PowerShares Double Long Base Metals (BDD)

I did these trades this week:

Sold HANS (Stock broke 50dma on Thursday; stock is seriously weak. After holding this trade for over 3 months, I am glad to move on to something new.)

Shorted BLUD (Being stopped out of a long suggests I should probe the short side of the market)


Well, the market continued its ascent this week, and being nearly entirely long, this was beneficial for me. As I have been saying for many weeks, the market continues to show incredible strength, and like last week, the path of least resistance is still up.

The number of stocks that are breaking out continues to astound me. For example, my 26 week high scan produced 257 results, and almost all of these look great. The vast majority of these candidates do not look overextended, and a great number have broken out of bullish consolidations.

Conversely, only 8 new stocks were making fresh 26 week lows, and 7 of these were inverse ETFs! Clearly, there is a lot of strength in the market right now.


Here is how my stock account looks going into next week:

Short BLUD (Shorted at worst possible time on Thursday, may get stopped out)
Long CAKE
Long EWA (Appears strong, and I may add to)
Long OCN
Long RHT
Long STEC
Long RBI.to
Long U.to (Has continuously gone down since I bought it, but will wait to see if stop is hit)


Anyway, here are the stocks my scans picked up this weekend:

Generally, I think it is unwise to invest in anything with daily volume of less than 100,000 shares, but, nonetheless, this ETF looks appealing.

Suitable alternatives to this ETF are JJC and DBB


Have a great week.

Oil Services Holders (OIH)

As the US Dollar continues to weaken precious metal and commodity related stocks are doing exceptionally well. This ETF below is another example of this:

As a side note, a falling US Dollar makes holding US Stocks less desirable for me (a Canadian), and makes me more inclined to invest in stocks denominated in currencies that are strong, which incidentally was the rationale for buying EWA.

EarthLink Inc. (ELNK)

This stock is in an uptrend and has made a new 26 week high:

Computer Science Corp. (CSC)

Here is another great looking chart. If only I had the margin to buy these all:

Canadian Pacific Railway (CP)

This stock looks like it has just broken out of a bullish flag pattern and is currently in an uptrend.

Furthermore, out of the 250 stocks I examined today, I feel that this has one of the most constructive charts:


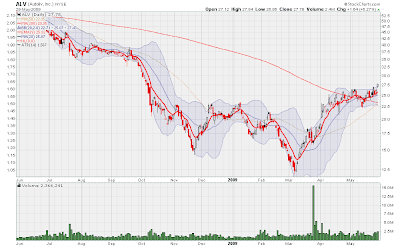
Autoliv Inc. (ALV)

This stock has recently broken out of its consolidation, and is making a new 26 week high:

PowerShares Base Metals Fund (DBB)

This ETF tracks the price of Aluminum, Zinc, and Copper. I was planning on buying this ETF, but today's weakness has so far turned me off:

ProShares UltraShort 7-10 Treasury ETF (PST)

This inverse bond ETF appears to be breaking out to a new high for the year:


Market Vectors Coal ETF (KOL)

This ETF invests in a basket of companies that derive the majority of their income from the coal industry.

As the chart below shows, this ETF is currently trading above its 50 and 200dma, which is indicative of an uptrend. A break above the gap resistance would make me a buyer:

Vanda Pharmaceuticals Inc. (VNDA)

In his excellent book, Fooled by Randomness, Nassim Taleb astutely points out that financial markets do not follow a normal distribution. The risk of observing an event that falls outside the normal distribution is called Kurtosis Risk.

Taleb discusses that this kind of risk is responsible for many investment industry blowups, like LTCM. However, the good news is that, as Michael Covel proves in his book Trend Following, momentum style traders, more often than not, tend to benefit from these rare events.

Shorting the stock below would have resulted in complete disaster, but no trend follower would have been short this stock in the first place, as it was above its 50dma, and making new 6 month highs at the time:

Emulex Corp. (ELX)

I did these trades this week:


Bought RHT
Covered SSW (Hard stop hit - trade did not work out)
Bought U.to


This week started off quite strong for me, strong enough to kill off my one short, but ended on some weakness. Two of my positions, HANS, and OCN displayed signs of relative weakness on Friday, and are now close to violating their 50 day moving averages. If (and only if) these stocks are stopped out, I will have to replace them with shorts again.

On the other hand, I noticed when I was doing my scans today that there are an incredible number of stocks making new 26 week highs (97 to be exact), and only 5 stocks that are making new 26 week lows. In fact, there were dozens of longs that I could have posted in today's post that look great, but for the sake of brevity, only posted the very best.

The fact that there are still an abundant number of stocks that look strong, and so very few that look weak, suggests to me that the market as a whole must still be strong. And this thought seems to be confirmed by looking at most market indexes, as the Dow and S&P are still both above their 50dma, and the Nasdaq is above its 50dma and 200dma.

I think the most professional way to view the market right now is to accept the fact that the market is still strong, until the point where it becomes weak again.


Anyway, here are the stocks my scans picked out today:


A large move, either up or down, could be next for the stock shown below. However, since the trend is up, the odds favour the upside:

Centerra Gold Inc. (CG.to)

Notice the tightness of the bollinger bands on this stock. A large move could be next:

Aon Corp. (AOC)

This stock closed at the exact low for the week. It is the only new short that I am able to find this week:

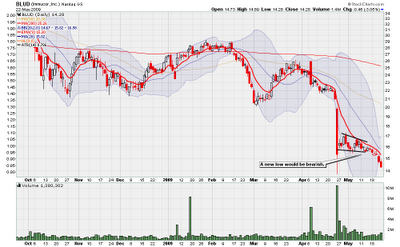
Immucor Inc (BLUD)

I mentioned this stock last week as a possible short candidate. It remains one of the weakest stocks that I can find:

Tata Motors Ltd. (TTM)

This stock is breaking out to a new 6 month high on impressive volume:


IAMGold Corp. (IAG)

Many gold stocks showed exceptional strength this week. The stock below, IAG, is breaking out to new highs:


PowerShares Agriculture Fund (DBA)

This ETF is making a new 6 month high. In my view, especially in the commodity markets, there can be a lot of money flowing into markets that are making new multi-month highs due to programmed trading. For example, some computer based trading strategies will automatically buy a commodity if X number of day's high is taken out.


AsiaInfo Holdings Inc (ASIA)

This stock is currently in an uptrend:

Uranium Participation Corp. (U.to)

In my opinion, the daily chart of U.to, shown below, looks favourable. One characteristic about uranium that I have noticed is that it is extremely uncorrelated to any other asset class. In other words, it adds diversification to my portfolio which is mostly long equities.

I bought shares of this ETF today at $8.30. As always, my stop loss is set at twice the stock's average true range, which is at around $7.55, or a violation of the 50dma; whichever comes first.

Copper ETF (JJC)

I attempted to buy this ETF this morning, but unfortunately, my broker does not provide 3:1 margin on it, so I did not have enough buying power:

Red Hat Inc. (RHT)

I mentioned this stock in the weekend post. I actually ended up buying this stock yesterday at $19.07, as I felt that the $19.00 area was proving to be support.

Please click on the chart below to see the fascinating story of how the bulls and bears are battling it out at the $19.00 price level:

Plantronics Inc (PLT)

This great looking chart was also identified by the excellent blog Momentum-Trader.com.

This site is one of the few sites that is not constantly trying to call market tops and bottoms (which I detest), and relies mostly on price and volume for its analysis.

America Electric Power Co. (AEP)

This stock is trading below its 50dma and also below its 200dma. Furthermore, the 50dma is below the 200dma. To me, this is a recipe for a downtrend.

I only plan on shorting this stock if the market is weak enough to shake out one of my longs:

Alexandria Real Estate Equities Inc. (ARE)

Here are the trades I did this week:

Bought RBI.to
Sold BMC (stock was not able to hold its 50dma)
Shorted SSW
Sold AMZN (stock was not able to hold its 50dma)
Sold May FXA 72 Calls (Friday was options expiration day)


This week's market correction was strong enough to eliminate 2 of my long positions. To me, this means that the market is trying to tell me something, and that is to start exploring the short side of the market again.

The first stock to succumb to the selling pressure was BMC, and after the stock was eliminated from my portfolio, I shorted a stock, SSW, as being stopped out of a long position must mean that the market is starting to weaken.


There are 2 scenarios that can occur next week:

1) The market continues to fall, and more of my long positions will get stopped out. If this scenario occurs, then I will replace all stopped out positions with shorts, and attempt to profit from the continuation of the long-term bear market in which we are still in.

2) The short term rally continues, and my 1 short candidate will likely get stopped out. If this scenario occurs, I will replace my short with another long, and assume that this week's correction was just a bump in the road within a strong bear market rally.


Here is how my portfolio looks going into next week:

Long CAKE
Long EWA
Long HANS
Long OCN
Short SSW
Long STEC
Long RBI.to


Anyway, here are some short candidates that I may consider for next week:


Fulton Financial Corp. (FULT)

Notice how this stock rallied weakly in the general market's upswing, and now seems to be falling more quickly on the market's down swing:

National Penn Bancshares Inc. (NPBC)

This stock is in a downtrend, and looks weak:

Southern Co. (SO)

Notice how this stock just could not surpass its 50dma even with the help of a strongly rising market. Now that the market appears weak, the bulls appear to have given up:

Red Hat Inc. (RHT)

I only plan on adding another long position if the market becomes strong enough again to stop out one of my shorts:

Seaspan Corporation (SSW)

Today's post contains 2 potential short candidates. Short candidates are still difficult to find, but since I am scanning through over 10,000 stocks, there are still usually a few that pop up.

I am only going to go short if any of my long positions get stopped out. I am not implying that I think the market is going to correct by posting short candidates, but I am open to the possibility that it could happen. I think it is important to be flexible in your expectations of the markets.

Immucor Inc. (BLUD)

This stock is in a downtrend and looks very weak:

TNS Inc. (TNS)

A break above the upper blue line would be favourable:

Fortress Investment Group (FIG)

This stock is in an uptrend:

Red Back Mining (RBI.to)

This stock has several favourable qualities. Firstly, notice the very bullish quadruple top breakout. Secondly, the stock is making a new 52 week high. Thirdly, the stock is in a short, medium, and long term uptrend.

I plan on buying this stock on Monday:

I did one trade this week:

Bought EWA


This week was very profitable for me. Most of the stocks in my portfolio continue to show strength in this incredible rally.

Obviously, we will experience a correction at some point, and when we do I will get burned, but I have no idea when that will come. As a trend following trader, all I can say is that the market is incredibly strong, and going long is what is working right now.

Textron Inc. (TXT)

I identified this stock on this site in February. The chart below shows that the trade would have been fairly mediocre.

More importantly, the stock appears to now be in a short-term uptrend:

IAMGold Corp. (IMG.to) or (IAG)

This stock is in an uptrend:

Ocwen Financial Corp. (OCN)

Here is a stock that continues to show strength. I may consider adding to OCN next week:

Kirkland's Inc. (KIRK)

Psychologically, buying this stock would be very difficult. This is sometimes what I look for when buying a stock. A break above $7.00 would be bullish:

Australia iShares (EWA)

Here's an ETF that gapped above its 200dma. Because I am bullish on the Australian Dollar, and because I am also bullish on stocks in general, it is only natural to be bullish on Australian stocks as well.

I went long this ETF at the open today. My stop loss point is $14.52 or a violation of the 50dma; which ever comes first.


My capital remains fully deployed on the long side of the market. The reason for this is because the market is strong, and the trend is up.

For weeks, I have heard many other investors say that the market has become overbought, and, as what often happens, the market has become even more overbought, which means that they are now even more right. One thing I have learned is that being right and making money are two completely different concepts.

Semtech Corp. (SMTC)

Here is a stock that I came across on Momentum-Trader.com. A decisive break above $15.00 would be favourable:

Trend Following for Conservative Investors

One common misconception that I occasionally read about trend following is that it is somehow more risky than other investment strategies. In my opinion, trend following can be as conservative or aggressive as one wishes it to be.

One way for conservative investors to use a trend following approach is to create hedges. To create a hedge an investor can go long one type of investment, and simultaneously short another similar investment. An example of this would be to go long the Nasdaq, and short the Dow Jones.

The chart below shows the result one would attain by buying the QQQQ (Nasdaq) and shorting DIA (Dow):


The Dow and the Nasdaq are fairly closely correlated, but not perfectly correlated (if they were perfectly correlated, the above chart would be a horizontal line).

The above chart shows that the Nasdaq underperformed the Dow from September 2008 to December 2008. Therefore, money could have been made made by shorting the Nasdaq, and buying the Dow.

Since the new year, the reverse has been true, and money could have been made by buying the Nasdaq, and shorting the Dow. And using this strategy could be profitable in a rising or falling market. If the general market falls, money is made if the Dow falls more than Nasdaq and vice-versa.

Furthermore, the above chart should be treated like a single entity. So if I were to take on such a position, I would ride this relative trend until the 50dma was taken out (just as I would if I were trading a single stock).

There are many other hedges that can be created; the only requirement is some experimentation and imagination. Another example is Apple versus Microsoft:


The above chart shows that Apple is a stronger stock than Microsoft, and money could have been made by buying Apple and shorting Microsoft. This type of hedge is much more conservative than just holding Apple or just shorting Microsoft. Each side of the hedge can offer some protection in a rising and falling market, and can therefore be more conservative than even a traditional buy and hold strategy.

Alaska Communications Systems Group. (ALSK)

Notice how this stock came up to its 50dma and was rejected by the bears on about 20 different occasions. Today was different. The bulls thoroughly defeated the bears and closed the stock well above its 50dma.

To me, this means that the bulls have control of the stock, and it is now in a short term uptrend:


I did one trade this week:

Bought STEC


There are many stocks that look favourable right now. Many of the stocks that I have posted in the previous weeks continue to show strength. Here are some previous stocks that I have identified that I am going to consider buying or adding to:

HANS
FIU.to
Copper
The Australian Dollar
HMC
TBT

Copper ETF

This fund still looks favourable to me:

PPG Industries (PPG)

A close above the 200dma would make me a buyer: