Why Trend Following Traders Bet Small and Bet Often

This weekend, I completed Jack Schwager's "The Little Book of Market Wizards: Lessons from the Greatest Traders", which distills three decades of market wisdom into what was a very enjoyable read.

One of the most thought provoking quotes from this book is as follows:

"...if you asked a hundred mathematicians the question, 'I have $1,000 that I want to bet in roulette - what is the optimal betting strategy I should use?,' all 100 should give you the same answer:  Take the entire $1,000 and place it on red or black (or on odd or even) for one spin, and then, win or lose, walk away....   


...your negative edge will be smallest for one spin. The more times that you play, the greater the probability that you will lose..."


In other words, besides simply choosing not to play, your best bet in roulette is to make as few bets as possible, since the odds are against you.

But how about in the opposite situation when the odds are in your favour?   This is the perspective that the casino itself faces, and the optimal strategy is also the opposite:   take bets very often, but keep them small.

Casinos benefit not only by having the odds stacked in their favour, but also by keeping bets small, by enforcing table limits.

Like a casino, a professional trader should only take on a bet when the odds are in his favour, bet small, and bet often.

Trading small is also beneficial in that it allows for more bets to be taken.  In addition to smoothing out volatility, having more bets increases the odds of finding the rare outlier, the positive Black Swan, the pharmaceutical stock, for example, that triples in value overnight.

Most traders, however, are betting too big.   For example, if you are risking much more than 3% of your account capital on each trading event, then eventual bankruptcy becomes a mathematical certainty.

Why do traders bet big?  It's because they have a false confidence in what the future will bring. Professional traders, on the other hand, have come to accept that the future is unknowable, and have accepted that the stock market is an unpredictable domain.  It's a cruel irony that those who appear to have the most confidence about the future of markets - and thus most likely to influence others - are also the most likely to fail as traders.

Nassim Taleb is someone who understands this concept and has built his career by using options to make many small bets that have limited downside and unlimited upside:


"...when people go for small bets in highly unpredictable domains, and in a field that nobody really understands very well, you have a huge upside..."


How Great Traders Do Not Lose Millions in Up or Down Markets


The year 2014 has, so far, been a very challenging one for my trend following system, with the Russell 2000 generating 4 whipsaw signals since January, yet making zero progress for the year.


As a trend following stock trader, I do not need a rising market to make money - I need a long term trend, either up or down.   The chart below shows the Russell 2000 moving in a choppy, erratic manner:


Not only have small caps not trended this year, but they have severely under-performed large caps, which has been another head-wind.

This year has some similarities with 2011 in this regard, but unlike 2011, there are also few other trends in other asset classes that have worked out (like silver or gold did in 2011), which is another head wind.

Because of these factors, my stock trading system is experiencing a drawdown.   This is nothing new, as my equity curve has been a rocky road since day one (which I argue is sign of robustness, not fragility).

However, here are 8 steps which I am prepared to take to help mitigate my current drawdown in order of severity:


1) Sell losing positions

I always sell losing positions, with the objective of no one trade being able to reduce my total equity by more than 1%.    This is nothing new, but Jason Russell over at Acorn Global Investments has created a video to demonstrate this concept in a novel way.


2) Stop using margin

I use much less margin than I did during my youth, which is a trend demonstrated by several market wizards who I consider old traders, not bold traders. 

Nonetheless, if I do use margin, it is only when the trend is strong, and the odds are firmly in my favour.  Now is not that time.


3) Reduce Position Size

A drawdown, by definition, reduces the amount of capital at my disposal.    Thanks to my position sizing formula, the less capital I have, the smaller my positions are.    This keeps my drawdown linear, while persevering the potential to grow my account exponentially.


4) Lower the percentage of my capital that I risk on each trade

I have mentioned many times in this blog the importance of limiting risk to 1% of account capital, meaning if you get stopped out, the value of your brokerage account falls by just 1%.   However, this number can be adjusted (downward only) in the event that your odds begin to move against you.

This concept was introduced to me in one of Michael Covel's best podcasts with card counter Mike Aponte and explained in more detail here. 


5) Cease adding to winning positions

Amateur traders hang on to losing trades, and pre-maturely sell winners;  professional traders cut losses short, and add to winners.   However, adding to winners works better in a rising market, and should be stopped once the general market weakens.


6) Discontinue adding new stocks to my portfolio

If the general market's trend does come to end and turns down, it is best to stop buying new stocks, as I would never want to fight the trend of the general market.     If I don't have an edge, then I stop betting.


7) Diversify in other systems and assets classes

It's important to remember that equities represent just one of many different assets classes.   If the market continues to struggle, why not deploy some capital to some completely different market, such as managed futures, fixed income, or precious metals (if they are trending higher).


8) Short sell market indices or individual stocks

Shorting individual stocks is a losing proposition on average, but when the trend is right, as it was, for example, in 2008, then shorting stocks can pay off.  

Trend Following Using All Time High ETFs

Contrary to the market adage of buy low and sell high, I prefer to buy stocks at the highest possible price: a new all time high.

If a stock or ETF is making a new all time high, then it is, by definition, in an uptrend.  

Given this week's price action in the market, there is no shortage of new ETFs making new all time highs, which to me is clearly and simply a bullish development.

Firstly, QQQ printed a fresh round of new 52 week highs this week:


Secondly, although not as strong as QQQ, the Russell 2000, as represented by IWM, did gap up above its 50 day moving average, and is on the verge of returning to a short term uptrend (within the context of a strong long term uptrend).


But it's not just strength in US markets that is apparent, with European stocks rising strongly this week. The ETF below is the Germany iShares, and it is clearly breaking out of a constructive 6 month consolidation area to new all time highs.


Finally, this European related ETF printed a new all time high on Friday on heavy volume.   


The bottom line is that if you are bearish on the market, then you are wrong, and the pure price action of the market proves this.

Trend Following Trading Using 52 Week Highs and 52 Week Lows

When I first became interested in making money in the stock market, my initial strategy was to seek out stocks making new 52 week lows, as I felt that stocks doing so would be poised for a big rebound.   Today, fourteen years later, I find myself doing the exact opposite.

It is completely counter-intuitive to a novice trader, but buying new 52 week highs and short selling new 52 week lows can be very profitable.

One challenge I have experienced recently is that there are fewer and fewer stocks making new 52 week highs.  Although the Dow and the S&P 500 are still on mechanical uptrend signals for me, beneath the surface there are thousands of smaller cap stocks that have broken down badly.  This can be illustrated in the following chart:


The chart above shows the tech laden QQQ divided by the mega cap dominated DIA.   In my opinion, the strength in the Dow is masking a great deal of weakness occurring under the surface.

Although the Nasdaq has been weak, I am not interested in shorting at this point.  The long term trend of QQQ remains up, and the index has yet to form a new 52 week low. Just as I only buy assets making new 52 week highs, I am also only interested in shorting new 52 week lows.

Amazingly, during the years 2009, 2010, 2011, 2012, 2013, and 2014 the number of new 52 lows printed by QQQ has been exactly zero which, to me, means zero short signals:


The bottom line is that I a not highly motivated to buy stocks nor short sell stocks at this time.

There are, however, many other opportunities besides stocks.   Given that there are perhaps over 1,000 different ETFs, there will always be a bull market somewhere.

As an example of this, take this agriculture ETF:

Notice, for the first time in 3 years, new 52 week highs are being formed.   This is bullish action and I currently have a position.

Another agriculture fund, DBA, is acting similarly:


Another asset class which is making new 52 highs almost daily is preferred shares:

Preferred shares have held up very well during this most recent sell-off and have been paying me an attractive monthly dividend while I wait for other opportunities to emerge.

Likewise, utilities have been one of the strongest sectors and have recently been making new highs as well:


One of the advantages of trend following is the willingness to go both long and short.  So, just as new 52 week highs are bullish, a trend follower should also seek to short sell new 52 week lows.   One asset class that is approaching new lows is Silver:


Silver is down about 62% from the top, and has made many new 52 week lows to get to this point, yet zero 52 week highs have formed since then.


The Trouble of Trend Following in Bubbles

In this post, I will discuss a disparate series of charts that have caught my attention this weekend.  

First, we have a daily chart of the S&P 500:


What I find noteworthy is the extreme selling volume that took place on Friday.   Also, notice the bearish black candle that form on that day.   It is true that one bearish candle on one daily chart could just be noise, but other pieces of evidence appear to be lining up as well...


Second, let us examine what has been the leading sector propelling the American market higher: biotech.


The daily chart above illustrates the price of IBB (the Biotech ETF) slicing through the 50 day moving average.   This fact makes this ETF unbuyable for me, since it breaks Trend Commandment #3 (see previous post).    Furthermore, it did so on the highest volume in years.


Zooming out, we have next a weekly chart of IBB:


Notice the last 4 bars of immense selling volume.


Zooming out further still, we now have a monthly chart of IBB:


When I enter a position, I am looking for what is known as an asymmetrical risk to reward relationship. In other words, if I am wrong (and I am wrong a lot), I want to lose very little, but in the event that I am right, I want the potential gains to be extremely high.

This ratio of low risk and high reward no longer exists with IBB, and the relationship is now one of extreme risk, but, like any bubble, potentially high reward.   This is not a combination that I am seeking to trade.


The fact that the market's hottest sector is looking particularly vulnerable is problematic, but it gets worse.   Globally, other markets as a whole are looking weak.

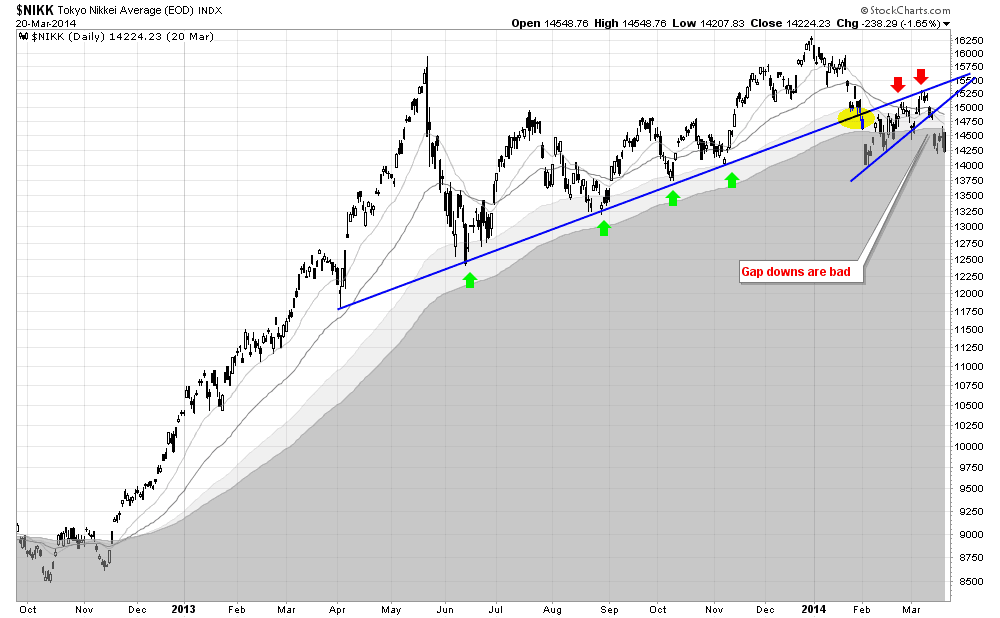
Moving on, below is a chart of the Japanese Nikkei:


Admittedly, the Japanese stock market appeared bullish to me at the end of last year, but as the facts (the price action) changes, so must my opinion.

This whole enormous consolidation pattern has tragically (for the bulls) broken down hard.  The price action has gapped down, and the long term moving averages are rapidly closing in on each other, which would usher in a full blown bear market.


And it is not just Japanese stocks, but also German stocks that look sickish to me:

The chart above shows the German DAX entering a short term downtrend, as the 20 day moving average as plunged below the 50 day.   A classic head and shoulders pattern which is now complete adds further support to the bearish case.


Finally, here is a monthly chart of copper:


As a trend following trader, I am attracted to higher highs, and higher lows, which is why copper is something that I have no interest in buying.  At this current moment in time, copper is trading at a 3 year low, while also completing a massive head and shoulders-like top.