Stocks Breaking out of Boxes

I like to buy stocks breaking out to new all time highs.   On balance, I feel that this gives me an edge in the market, but it does not work every time, of course:


I bought the stock above on Monday thinking that it could break out from its bullish flag formation.   It broke out alright, but then immediately reversed hard, stopping me out at a loss.

One thought pattern that I have been cultivating is to think in terms of the next 1,000 trades.   Sure, based on a sample size of 1 trade, this stock did not work out, but would this strategy work based on a sample size of 1,000 trades?     To expand on this idea, I recommend watching this YouTube video.   


Moving on, the following stocks are the highest potential stocks on my watch list right now:


Why it's Difficult to Let Winners Run

I've read many books this year, but one of the most intellectually stimulating so far has been Daniel Kahneman's "Thinking, Fast and Slow".

One part of the book that I found particularly fascinating was the following hypothetical example. Imagine you are given a choice between these two options:


  • Option #1:   You are offered one million dollars, in cash on the spot, with no strings attached
OR
  • Option #2:   You are offered a 95% chance of winning two million dollars, but a 5% chance of winning nothing at all


Kahneman explains - and I'm sure you feel the same way - that pretty much everyone who is asked prefers the first choice, which is rather odd seeing as how the second choice offers a much higher expected value.   Any purely rational person should, in fact, select option #2.


Here is the same example as above, but with a trend following twist:


  • Option #1:   You are sitting with a large open profit on a stock you bought recently.  You can lock in the profit immediately and be 100% sure you will capture this gain
OR
  • Option #2:   You are sitting with a large open profit on a stock you recently bought.   If you continue riding the trend higher, chances are that your profit will grow even larger, but at the same time there is a small chance that this profit will disappear in a flash and you'll end up with nothing

Again, most traders are going to do option #1.    It's just human nature to lock in profits rather than take a chance with them.   The job of the successful trend following trader is to fight this urge and let profits run until the trend ends, no matter when that may be.


"While amateurs go broke by taking large losses, professionals go broke by taking small profits. The problem in a nutshell is that human nature does not operate to maximize gain but rather to maximize the chance of a gain." 

-William Eckhardt


Buying All Time Highs

Last week, I read a news article showing that had you invested in Chinese stocks for the last 20 years you would have earned a grand total of 1% on your investment.

I've read books about China's supposedly excellent fundamentals, mostly by renowned investor Jim Rogers, and I have experienced some of the country's economic advancements first hand while I lived there for 2 years teaching English, but none of this translated at all to investor's profits.

In fact, there is one thing (and only one thing) that can translate into making money in the markets:  price.

As a trend following trader, the price action always overrides any opinion or belief I may have.   Specifically, I like to buy assets that are making new all time highs.    Here is a chart of Chinese stocks focusing on this price action sweet spot:


By concentrating on buying new highs, you would have participated in the majority of a huge bull market that unfolded in 2007, while ignoring all of the sideways trendless price action that has occurred since.


But it's not just stocks that are worth buying at new all time highs.   If any asset class is making a new all time high, I want in.   For example, take this Crude Oil chart:

Crude Oil starting making new all time highs in 2004.     Although it may have seemed "too high" at that price, as it had tripled already, yet it went on to triple again, forming hundreds of new all time highs along the way.

Currently, the only asset class that I am aware of that is making new all time highs is US stocks. Although never a guarantee, buying strong US stocks making new all time highs powerfully places the odds in your favour.

The PowerShares DWA SmallCap Technical Leaders ETF

Yesterday, I came across an innovative new ETF that may be of interest to trend following traders.

Ticker symbol DWAS, what the fund does, in a nutshell, is out of a universe of 2,000 American small cap stocks, it invests in the top 200 of those that are displaying the strongest relative strength price action, then rebalances the portfolio quarterly.

Relative strength, not to be confused with the (useless) RSI technical indicator, means that a stock is doing better than the general market.   For example, if stock XYZ has gone up 20% in the last quarter, but the general market has only gone up 10%, then XYZ stock is showing relative strength.

All of the stocks that I mention on this blog are showing strong relative strength.

So, is this strategy actually working?    Well, according the creator's website, this ETF is doing much better YTD than the competition, as the following table shows:


As the table above shows, this fund has outperformed every single one of its competitors, year to date.

The chart below shows DWAS outperforming the Russell 2000:


The bottom line with this ETF is that I think the strategy is sound and I think it is a good product. However, one concern I have is that it is "always in the market",  meaning that the fund cannot escape into cash in the event of a major market meltdown, so this fund will likely lose money in a 2008 type year.

There is only one ETF that has a strategy that would dodge a market collapse, and I blogged about it before here.


High Potential Stocks of the Week

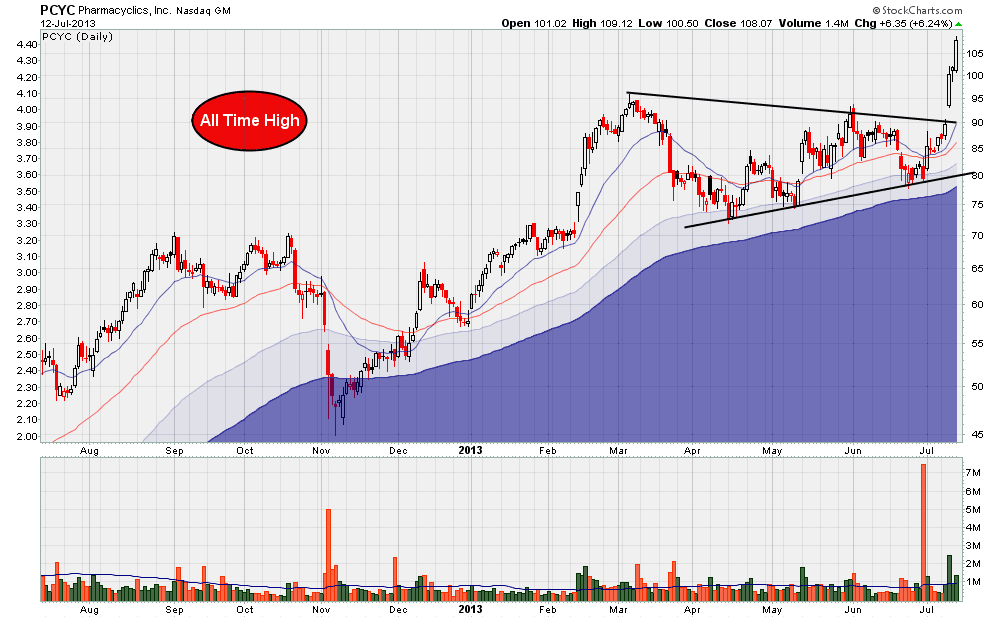
The price action of US stocks has proved my previous bearish view wrong.   Admitting defeat, I bought the following two stocks on Monday:


The stock above has all of the characteristics that I am looking for in a stock:  break away gap up, constructive consolidation area, a fresh new all time high and heavy volume.


The second stock that I bought on Monday:


The above two stocks were introduced to me by like minded trader, Olivier Tischendorf.

On the subject of receiving tips, here are a few thoughts:


  • The suggestion must meet all of my pre-existing buy rules
  • The stock goes through my position sizer to determine the amount to buy
  • The stock is sold according to my system's sell rules
  • I accept personal responsibility for the outcome of the trade - never blame others


Next, here are two new stocks that my scans found this weekend:


Seven Reasons Why I Was Bearish on Bonds

1) The long term trend for TLT, the fund that tracks long term bonds, was down

2) TLT kept hitting new 52 week lows - never a bullish sign

3) TLT, over the past year, formed a pattern of lower highs and lower lows


4) The yield on the ten year bond was in an uptrend, both long and short

5) The yield on the ten year gapped up, twice

6) The yield on the ten year formed a tight bullish flag


7) The weekly chart of TLT formed and completed a long term head and shoulders pattern:


Emerging Market Trends

US markets rose this week, filling the gap I have referred to several times before.  The chart below is a daily chart of the Dow:


From a classical technical analysis point of view, the index is still in a downtrend, due to the pattern of lower highs and lower lows.   As such, the odds of achieving success through buying US stocks are lower now than earlier this year, when the Dow was in a full blown bull market.

As I mentioned last week, though, the long term trend remains up, so shorting American stocks is completely out of the question for me.

The bottom line for US stocks is that I am neutral.


Meanwhile, pretty much every other market that I look at appears much worse than the Dow.  For example, take this daily chart of the Brazil iShares:


Unlike American stocks, both the long term and the short term trend are both down, so this ETF may be sold short according to my system.

Possibly due to weakening commodities, the Chile iShares are also on a short signal:


Never in my trading career have I seen international markets diverge so drastically from US markets.   My plan for next week is to continue shorting emerging markets through my holding EUM and I will be buying 2 US stocks from the strongest sectors on Monday.  

Buying the strongest stocks in the strongest sectors in the strongest market while selling short the weakest, most vulnerable sectors gives me not only an edge, but also helps keep me diversified.