Ocwen Financial Corp. (OCN)

I did these trades this week:


  • Sold BDD (hard stop hit right on Monday morning)
  • Shorted PCBC (right away used margin from BDD to short this one)
  • Sold RHT (stock broke 50dma. Break even trade)
  • Shorted GME
  • Sold CAKE (stock broke 50dma)
  • Shorted FULT

My system caused my account to become much more exposed to the short side of the market this week. Monday's weakness was the last straw for some longs, which were just barely hanging on.

Some of the longs that I am still holding, like OCN (see below), seem quite hearty, and have so far not been shaken by this recent weakness.

Now that my account is net short, I find myself looking at charts at a bearish angle. Interestingly, it is not a case of me looking at the charts with a bearish angle and thus deciding to become net short.

One psychological dilemma that most traders face (even if they are not aware of it) is that if they are heavily long, they will see all of the bullish aspects of the chart, while if they are heavily short, they will notice only the bearish aspects of the same chart. This is known as the confirmation bias.


Here are 2 charts that are a manifestation of my confirmation bias:


The chart above shows the Nasdaq stalling out under major gap resistance. The second chart shows the Australian Dollar divided by the Japanese Yen (the carry trade, basically):


To be clear, these charts are only for entertainment purposes, and they do not, in any way, have an influence on my trading. I only follow the rules of my system, and this helps keep many psychological issues, such as the confirmation bias, at bay.


Anyway, here is one stock that I am holding that I may add to if the market rises next week:

An Alternative to Buy and Hold Investing

As readers of this site might have guessed, I do not have a whole lot of respect for the buy and hold investment mantra.

I do not believe in buy and hold investing even after working in the financial services sector for several years (which is built on the foundation of buying and holding), and also graduating from a business college in which students are basically indoctrinated from day one to believe in efficient portfolios, sharpe ratios, and other pseudoscience.

But if one does not believe in buy and hold investing, what are the alternatives? After all, timing the market is very difficult, and not appropriate for retail investors. If you cannot predict the future, it is said, then is it not better to just buy and hold and expect returns over the long run?

I believe that a suitable alternative to buying and holding is a simple form of trend following. As I have demonstrated elsewhere on this site, trend following does not involve predicting the future, and I believe that it could be simple enough for retail investors.

The following is one system that I am going to start using to invest mutual funds in my own retirement account. I have mutual funds in my retirement account that can be switched every month without fees, so I have developed a system that should rarely give two signals in one month.

The system requires a daily chart of the S&P 500, 2 moving averages, and these rules:

  • If the 20dma is above the 50dma, then hold an equity index fund
  • If the 20dma is below the 50dma, then hold a bond fund (or an inverse fund or T-Bill fund)

Here is an example of how this system performed for the past year:


The chart above has an indicator, but is not entirely necessary, as it only shows the crossovers more clearly. The core idea is that you hold a bond fund when the blue line in beneath the red line, and hold a index fund when the blue line is above the red line. It cannot get more simple.


Here is how the system looked in 2006:


Notice that in a strong market, you are long most of the time. I don't mind buying and holding if the trend is up. However, buying and holding in a falling market, like in 2008, is insanity, and completely unnecessary.


Here is a look in the mid 1990's:


As the above chart shows, a buy and hold investor may have been slightly better off than a trend follower, but not by much. A trend follower still would have been long about 90% of the time in 1996, and would have had an excellent year.


Here is a look at the same system in the mid 1980's:


The above chart shows that a trend follower would have been long most of 1987, as the market was rising, but weakness in October would have caused a trend follower to switch into a bond fund, thus avoiding the 1987 market crash.

If you would like more detailed performance data on these type of systems, I encourage you to read Michael Covel's Trend Following. I have analyzed quite a lot of data in regards to simple trading systems, and I can say that historically, systems such as this have tended to produce average annual gains in the range of 11%-18% annually over the last 25 years.

It is also worth mentioning that I find it interesting that simple trend following systems, like the one shown here, consistently outperform portfolio managers who have earned MBAs, and other designations, like the very difficult to earn CFA designation.

To some, the fact that a system, that is simple enough that a child could use it, can beat a highly paid Wall Street investment professional with 25 years of education may be depressing. But to me, I think it is incredibly encouraging.

S&T Bancorp Inc. (STBA)

This stock is currently in a downtrend:


UAL Corp. (UAUA)

Although I prefer not to short stocks under $5.00, a break below $3.00 could be bearish:

WestJet Airlines Ltd. (WJA.to)

I usually have no idea what product or service the companies I post provide. I have some stocks in my trading account that I have been holding for months, and I still don't know what they do. I buy or short them based solely on the chart's characteristics.

But I am familiar with this Canadian airliner, WestJet, shown below. From my experience, they seem very well run, very organized, and an all around good company. But does this mean that I would never short their stock because of it? No. For me, the fundamentals mean nothing:

Calaway Golf (ELY)

I did 2 trades this week, both in the first few minutes of trading on Monday:

  • Sold ASIA (Hard stop hit, luckily without much skid)
  • Shorted ELY

Well, another stock perished as a result of further selling on Monday. Fortunately, I shorted ELY immediately afterward, and this helped to mitigate some of my losses.

I now feel that the stock market has entered a sideways trend, and the buyers and sellers are at about equal strength (for now). Interestingly, my system has caused my portfolio to be partially long and partially short, which I think makes sense in a trendless market.

Here is how my stock account looks going into next week:


  • Long BDD
  • Long CAKE
  • Long CSC
  • Short ELY
  • Long EWA
  • Short NPBC
  • Long OCN
  • Long RHT
  • Short VLO


Anyway, here is a look at the newest addition to my stock account:


Thanks for reading.

Sunoco Inc. (SUN)

This stock put in a bearish engulfing pattern on Friday. To some, a bearish engulfing pattern should come after the stock has run up, and is supposed to indicate that a stock is topping out.

In my view, if a stock is making a run up, it should not be shorted; regardless of the candle formation. The way I see it is that a stock in an uptrend means that the buyers are in control, but a bearish engulfing pattern indicates that sellers have momentarily taken control of the stock, so the combination, overall, would give me mixed messages.

However, a bearish engulfing pattern within a downtrend provides me with 2 separate pieces of evidence that the sellers are in control. The fact that the trend is down means that the sellers are more aggressive than the buyers, and the bearish engulfing pattern means, to me, that the buyers made an attempt to take control of the stock, but were, once again, defeated by the sellers.

This combination does not guarantee anything, but I think it does put the odds in one's favour:


Pacific Capital Bancorp. (PCBC)

I don't know why this stock is doing so poorly, but obviously someone does:

Carmax Inc. (KMX)

This stock has recently exploded out of its range on very heavy volume:

Wellpoint Health Networks Inc. (WLP)

This stock has recently broken out of a box. A perfect Nicholas Darvas type trade:


Hatteras Financial Corp. (HTS)

As a trend following trader, 52 week highs are always a positive:


3PAR Inc. (PAR)

Please click on the chart below if you want to have a closer inspection:

Matrixx Initiatives Inc. (MTXX)

Here is a stock that caught my eye today. The chart below shows MTXX at the close of trading on June 15th (yesterday):


The next chart shows the same stock at the close of trading today:


Notice how the stock closed down 70% today in what was one of the most dramatic one day moves I've seen in a while.

In my opinion, this emphasizes the point that, when it comes to the stock market, anything can happen.

I think it also stresses the importance of using hard stops. Even if a trader had bought this stock yesterday, he would not have had to take a 70% loss today if a proper stop would have been in place.

I examined the 1 minute chart, and it was not as though the stock plummeted 70% instantaneously. Rather, the stock crashed 70% mostly during the first few hours of trading, allowing stops to get hit.

Finally, I think it shows that "mental stops" can be a bad idea. This morning, this stock was crashing 10% every couple minutes, and anybody using mental stops would not have been able to react as quickly as a hard stop would have. In this case, a few seconds could have been very costly.

Fidelity National Financial Inc. (FNF)

This stock is showing signs of weakness:

Take Two Interactive (TTWO)

This is one of the better looking shorts posted today:

Allstate Corp. (ALL)

Hartford Financial Services (HIG)

This stock (barely) fits my criteria for a stock in a downtrend, which is:

  • The stock is below its 50dma
  • The stock is below its 200dma
  • The 50dma is below the 200dma

A more decisive break of the 50dma may give me reason to short this stock:

Eli Lilly & Co. (LLY)

I don't plan on shorting this stock yet, but it is starting to look interesting:

Marshall & Ilsley Corp. (MI)

This stock is still in a long term downtrend:

National Penn Bancshares Inc. (NPBC)

I did 5 trades this week, all on Friday:

  • Sold STEC
  • Shorted NPBC (see below)
  • Bought BDD (added to my existing position)
  • Sold ELNK (stock was a complete dud, but only lost 2% of my account on it)
  • Shorted VLO

Friday morning's selling pressure was strong enough to shake out 2 of my 9 long position. In my attempt to adapt my stock account to the ever changing market, I have replaced these 2 longs with shorts.

Therefore, I am still mostly long, which makes sense, as the general market is still in an uptrend. But I now feel that the bulls are now pushing the market up with less ferocity than before, which I think is evidenced by the 5 consecutive Doji formed on the daily chart of the Dow (more or less), and the failed breakout on the 60 minute SPY chart. Considering this, I feel much more comfortable holding at least some shorts.

So in my view, I really do think that the market has a 50-50 chance of rising or falling next week, whereas before, I felt the odds favoured the bulls.

In the event that the market does rise, my shorts may get stopped out, and I will have to replace them with new longs.

But if the market shows more weakness, my weakest longs will die off, and the scaling into shorts will have to continue.


Anyway, below is one of the weakest stocks I could find. As a matter of fact, this stock has made a new 16 year low today (that's never good):


Valero Energy (VLO)

My thought pattern for shorting this stock is this. The general market is up 40% from its lows, the price of crude oil has doubled off its lows, and this stock, despite this incredible strength, has still not seriously rallied (and has recently gapped down). If the stock cannot rally under these conditions, what is it going to take?

Cephalon Inc. (CEPH)

This stock is currently in a downtrend:

Callaway Golf Co. (ELY)

This stock below looks quite shortable, in my opinion. If the bears sweep away any of my long positions next week, I will consider shorting this stock:

7-10 Year Inverse Treasury ETF (PST)

This ETF, which basically is going to follow the yield of medium term US Treasuries, is currently in an uptrend:

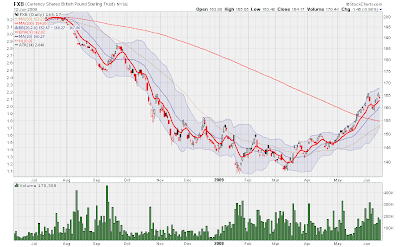
British Pound ETF (FXB)

The ETF below follows the British Pound against the US Dollar. Notice that the short term trend is up:

Following the Trend on the 60 Minute SPY Chart

Before I buy a stock, I like to briefly examine its intraday chart. The reason I do this is to make sure that the short-term trend is also up.

The chart below is a 60 minute chart of SPY. My method of analysis for a 60 minute chart is the same as for a daily chart. In this case, notice that the 50 hour moving average is rising, and above the 200 hour moving average, which is also rising. This is indicative of an uptrend.

I think that if the market can break out of this quadruple top formation, that would lend even more support to the bullish case:

Computer Science Corp. (CSC)

I would like to add to this position in the near future:

Leveraged Base Metals ETF (BDD)

I mentioned last weekend that I would not likely buy anymore stocks, since I already own so many. But if the market keeps rising, I will consider adding to existing positions, like this ETF below, which so far is working out:

First Solar Inc. (FSLR)

This great looking chart was originally identified on the blog The Art of Trading. I don't mind buying other people's stocks as long as it fits my own rules, and this stock definitely fits my rules for a long candidate.

Notice the bullish gap up, the recent golden cross, and the triangle formation:

MDS Inc. (MDS.to)

I did these trades this week:

  • Covered BLUD (This test position helps confirm my view that the market is strong)
  • Sold U.to (Hard stop hit. Stock has not been able to close above its open for 12 consecutive days)
  • Sold RBI.to (Hard stop hit. Good process that resulted in bad outcome)

I made money every day this week, except for Wednesday, but Wednesday's commodity sell off was severe enough to result in me being down for the week as a whole. Considering the general market rose for the week, this is a poor performance.

I am not going to try to find any additional long candidates at this point. I am now long 9 stocks, and buying new stocks I do not think will add very much marginal diversification.

If the market continues to rally next week, I will plow new margin back into my existing stocks.

If the market falls next week, my weakest longs will get stopped out, and I will replace them with shorts. Finding short candidates is still difficult, but this week's post has identified the weakest stocks in the market right now.

Some of the stocks identified are in sideways trends, but, in my opinion, a stock that is in a sideways trend when you have a market that is up 40% is still a weak stock from a relative strength perspective.

Here are the positions I am holding going into next week:

  • Long ASIA
  • Long BDD
  • Long CAKE
  • Long CSC
  • Long ELNK
  • Long EWA
  • Long OCN
  • Long RHT
  • Long STEC


Anyway, I would consider shorting this stock if it made a new low:


Cardinal Health Inc. (CAH)

This stock is trading below its 50dma and its 200dma; not a good sign considering the general market is above their respective moving averages:

Regions Financial Corp. (RF)

This stock, although not in a true downtrend, is performing much more poorly than the general market:

Valero Energy Corp. (VLO)

This stock has recently gapped down, and looks weak:

Varian Inc. (VARI)

I forgot to post this chart last weekend:

Moto Goldmines Limited (MGL.to)

I mentioned last Saturday that I own the stock Red Back Mining (RBI.to). This stock caught my attention again the following Monday when it unexpectedly gapped down 7%. I do not normally look at news for a stock, but my curiosity got the best of me.

It turns out that on Monday, news was released indicating that RBI.to was to buy another gold company called Moto Goldmines (MGL.to). I then proceeded to have a look at the MGL.to chart, and noticed something interesting. During the two days preceding the news announcement, MGL.to was already rocketing higher on the heaviest volume of the year.

What I have noticed many times with stocks is that the price moves before the news. The reason I believe this happens is that news is often leaked before it is officially released, and can spread like wildfire causing large movements in a stock.

While trading off insider information is illegal, I am absolutely confident that it occurs more often than most realize, and this is why I never watch television or trade off news flashes. By the time you, the average investor, hears a news flash on TV, it is almost certainly too late.

But there is a way that the average investor can gain an upper hand, and that is through the ability to understand charts. This is because charts leave clues as to what is happening behind the scenes. When, for example, someone with insider information buys 100,000 shares of a stock, the chart detects this information both in volume, and also in price action; there is no way to conceal this.

The chart below shows MGI.to on the top (the company being bought), and RBI.to on the bottom. Notice the top chart's behavior during the preceding two days before the "news" and the accompanying volume.

Also note the black candle that formed on June 1st, the day the news was officially released. This black candle shows how average investors, who excitedly bought the stock on this great news at the open, actually ended up buying the highest price of the day:


The bottom line is that the most important information a trader can look at is price and volume. The price is the consensus of opinion of thousands of different investors who, chances are, know more than you or I.

Gamestop Corp. (GME)

Here is an "okay" looking short candidate. Notice the bearish gap down:

OSI Pharmaceuticals (OSIP)

This stock appears to have broken support, and is currently in a downtrend: