Does Trend Following Trading Work for the Stock Market?

In this post, I will explain an incredibly simple, yet effective, trend following strategy that has been backtested all the way back to 1963.   The rules of the system are as follows:

  • If the Nasdaq is trading above its 100 day simple moving average, you buy it
  • If the Nasdaq is trading below its 100 day simple moving average, you sell it and go in cash


Here is an example of how this strategy would have worked for this year:


The Nasdaq was trading above its 100 day moving average for all of 2013, so you'd have bought and held.  If the market is going straight up, I have nothing against buying and holding. 

Where this strategy shines, however, is in bear markets.   The chart below shows the Nasdaq during the year 2002:


By selling and going into cash for most of 2002, the strategy does not make any money, but it does preserve capital, which is key. 

Here is a table showing a year by year performance breakdown of the strategy versus simply buying and holding:  (Source)


Over nearly the past 50 years, following this simple, passive, objective rule would have increased your rate of return by approximately 65%

In a sense, I use this strategy in all of my stock picks in that every one is always above its 100 day moving average.  In fact, by buying stocks making new all time highs,  you're pretty much always going to be doing this by default.


Breakout Stock Charts: ANW, OSIR, PNG, XOOM


The stock above, ANW, is breaking out to a new 52 week high and appears very bullish to me. 


Technically similar to XOOM, which I mentioned previously, OSIR represents a low risk, potentially high reward setup. 


 PNG bullishly gapped up and subsequently rose to print a new 52 week high. 

Market Trend Update

The general market remains strong, with the Nasdaq leading the way to a new 10 year high:


The chart above shows QQQ making many new 52 week highs this year, including a brand new high this week.  That's bullish.


Next, the S&P 500 remains in an uptrend according to my quadruple moving average timing model:


Notice that by simply using a 20 and 50 day moving average crossover, you would have been kept in this bull market for the entire year.

The chart above is telling me that we are currently in a bull market, which means that the path of least resistance is up and my primary focus, therefore, should be on buying strong stocks.


Charting New 52 Week Highs

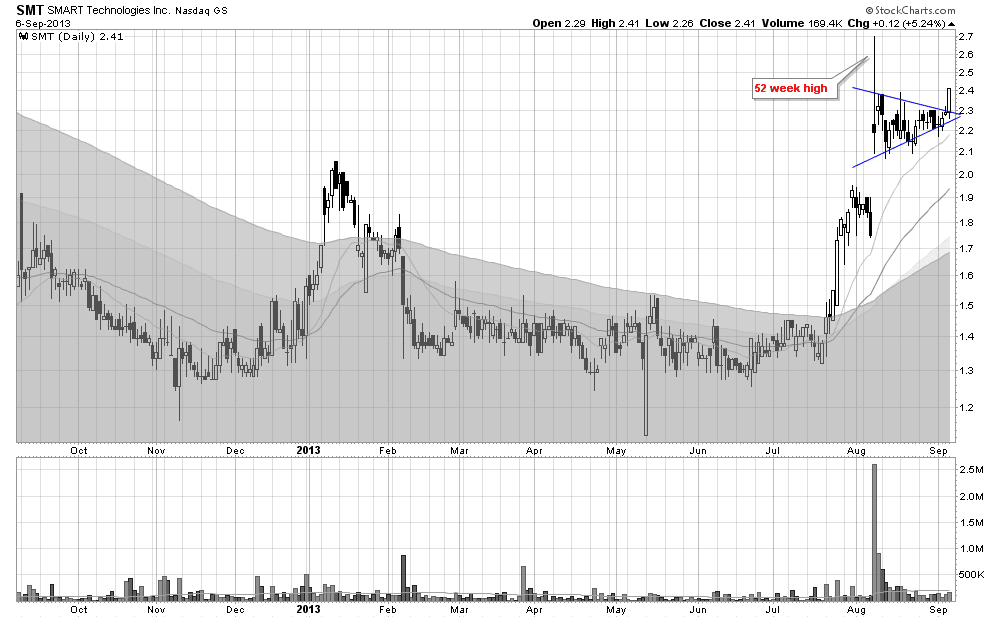
Most stocks that I buy are either making new all time highs or 52 week highs.   To better illustrate this fact, I have developed a new charting style which I will use in this post only to outline some of my current holdings:


There are some commonalities amongst all of these stocks:  

  • They are all at or near new 52 week highs
  • They are all above their 20 emas
  • They are all in short term uptrends
  • They are all in long term uptrends

By focusing on buying new 52 week highs, you will inevitably end up selecting some of America's most innovative and dynamic companies that are in the right sector at the right time.