Vivo Participacoes S.A (VIV)

I developed a new scan over the weekend. The results visually appear different from some of the other candidates I have identified. The objective of this scan is to still find stocks that are in down trends, but trends that are in earlier stages of development.

I will likely short this stock today depending on how it looks at the end of the trading day. Because it is a relatively low volume stock, I may need to purchase puts instead, since my broker needs to be able to borrow the stock.

World Fuel Services Corp. (INT)

This is a long candidate. Notice that the price has recently crossed the 50dma, and the 50dma is above the 200dma. This is the exact opposite of the two previous shorts:

Dean Foods Inc. (DF)

Another short candidate:

Sigma Designs Inc. (SIGM)

This is a short candidate. If I were to take a position in this stock, I would hold it until a cross back above the 50dma:


Salem Abraham on Trend Following Performance

Here is a very important quote from trend follower Salem Abraham's May 2005 letter to his investors:


Our research allows us to select trades that put the odds in our favor. However, it takes time to prove that the odds truly are in our favor. The statistics below demonstrate this truth:

Percentage of the time we make money in any day: 54%

Percentage of the time we make money in any month: 56%

Percentage of the time we make money in any 3 months: 64%

Percentage of the time we make money in any 6 months: 77%

Percentage of the time we make money in any 12 months :92%

Percentage of the time we make money in any 24 months: 100%

We do not have a crystal ball, so we do not know when this current losing period will end. However, we can look in the rear view mirror and see that when we experienced periods like this before, not only did we survive, but we thrived.


When I trade stocks, I want to put the odds in my favour. I believe that I am doing this by trading in the direction of the trend. However, even if you are trading with the odds, you will not make money every day or even every year.

Many traders believe that to make money in the stock market, they must find an indicator or system or chart pattern that will work at least 80% of the time. What I have observed is that most of the great traders, the one's that trade north of $100 million, are far from making money every day.

Incidentally, this is how casinos make money. For example, when a roulette wheel is spun, a casino has no way of telling what the outcome will be. Casinos, like trend followers, are not able to predict the future. But, casinos know that if a roulette wheel is spun enough times, they will come out ahead, and this is because the odds are in their favour.

On a practical level, one very simple way to put the odds in your favour in the stock market is, again, to trade with trend. A very basic rule of thumb that I follow in this regard is this:

  • Buy stocks making new highs in bull markets
  • Short sell stocks that are making new lows in bear markets

There is more to trend following than this, but even if you follow this very simple rule, I think it will give you a small edge. If a small edge is repeated over time, the results can be surprisingly good.

iShares Lehman TIPS Bond Fund (TIP)

A neutral to slightly down week for me this week. The market continued to rise, but that was more or less inconsequential, as nearly all of my shorts have been stopped out. I can now safely say that if I had kept my original shorts in attempt to ride out this rally, my losses would have been catastrophic.

Here are the few trades I did this week:

Covered DOW
Bought UGA
Covered LXK
Bought PLL April 20 Puts
Covered CEDC
Bought TIP May 104 Calls


The reason I went long the ETF below is because it is in a short term uptrend. I also find the fact that it broke through its 200dma favourable:

The reason I bought calls, rather than buying the ETF outright was to obtain more leverage. The above ETF, which tracks Treasury Inflation Protected Bonds, is not very volatile, and it would cost me too much margin to take a sizable position in this fund.

One of my risk management rules is to take small positions in very volatile securities, and larger positions in less volatile securities.

Another factor was currency risk. To take a large position outright would have caused me to hold thousands of US Dollars. Although the calls themselves are in US Dollars, it is a much smaller amount.

If these calls expire worthless (which could easily happen), then I will lose approximately 3% of my total account equity.

Pall Corp. (PLL)

Here is one stock I shorted this week. The reason I am continuing to short is not necessarily because I am bearish on the market, but because if I did not, I would be 100% long. Even in a bull market, I would not be 100% long, so there is no justification to be 100% long at anytime:

Momentum Trading Bond ETFs

Below is a chart of the ProShares UltraShort Lehman 20+ Year Treasury ETF. It is designed to rise 2% for every 1% long-term treasuries fall on a daily basis:


Going long this ETF is similar to going long the bond's yield, which can be charted by typing $TYX into StockCharts.com:

Because bond prices and bond yields are inversely correlated, it makes sense that an inverse bond ETF would have a similar chart to a bond yield chart.

Alternatively, if you were bullish on bonds, you could short the inverse ETF, which would fall if bonds rose. A more straight forward option would be to just buy another ETF altogether, TLT, which follows long term treasuries on a one to one basis:


The reason I bring these ETFs up is that they can provide additional diversification to one's portfolio. For example, in the late part of 2008, this was one of the only markets that was performing well.

Currently, these funds are in sideways trends, but I am waiting patiently for the next trend to emerge.

Currency Shares Euro Trust (FXE)

This ETF follows the currency exchange rate between the US Dollar and the Euro. As you can see, the short term trend is up, as evidenced by the recent crossing of the 50 dma. Additionally, it appears that a potential bull flag is forming:


ProShares UltraShort 20+ Treasury ETF

Here is another ETF that is on my radar screen. More on this ETF on Thursday...


United States Gasoline Fund (UGA)

A few weeks back, I mentioned that Gasoline was outperforming Crude Oil. I still think that this ETF looks bullish, and decided to go long today.

This ETF is making a 4 month high on strong volume, all while crossing its 50 day moving average. When a stock crosses above its 50dma, it is telling me that at least the short term trend is up:


Trend Following Draw Downs

Over the past two weeks, many of my positions moved against me very sharply, and most were stopped out. One of the foundations of trend following trading is to take small losses, but what occasionally happens is that many small losses will begin to add up to a large loss. When this occurs, it is referred to as a draw down.

As far as I can tell, all trend following traders experience draw downs, and it appears to me to be an inevitable cost of doing business. But what can make a huge difference is how trend followers handle losses. Here are some tips that I have picked up from other great traders on how to mitigate draw downs:

1) Cut Losses

I always place my stop loss orders immediately after a trade goes through. This way, when a draw down occurs, positions are stopped out quickly, and without a lot of the psychological issues that plague traders that use mental stops or no stops at all.


2) Get Small

If your account is shrinking in size, then so should your positions. If you traded 100 shares when you had $10,000 then you should only trade 50 shares if you are down to $5,000. This is is sometimes referred to as an anti-Monte Carlo money management system. During favourable periods, my portfolio will become larger, which helps it grow exponentially. During difficult times, my portfolio shrinks, which helps keep losses linear.


3) Spread Out Positions

All great trend traders spread their account over many different asset classes to help prevent draw downs. A portfolio that is too heavily concentrated in one area runs the risk of being wiped out by a large black swan type of event.

Here is a graph I found on Michael Covel's blog. I think it is a reasonable guide to helping diversify one's portfolio. As you can see, stocks are a relatively small component, but there are numerous ETFs that can provide exposure to almost all of the other categories:


4) Get to the Source of the Problem

This recent draw down caused me to go into a margin call. I think that once you are in a margin call, you should not add additional funds into an account. Positions should be eliminated instead. The positions that should be eliminated should be the ones responsible for the margin call. So, in this case, my margin call was caused by shorts being squeezed, which means that I should cover shorts; not sell longs.


5) Take a Break

After a loss, it is tempting to try to immediately trade again to quickly recuperate those losses. Because losses can be emotionally destabilizing, this kind of revenge trading usually only exacerbates the problem. A lot of the books I've read seem to recommend taking a rest until your mind is clear again before trading.

Kansas City Southern Corp. (KSU)

Well, another difficult week to be a bear. Some stocks have risen 11 consecutive days in a row, while others have tripled or quadrupled in price. Consequently, most of my shorts (except for a few very weak ones) have been stopped out.

Here are the positions I am holding currently:


Long:

AMZN
HANS
OCN
SLV
STAR


Short:

CEDC
DOW
KSU
LXK


Despite this rally, my method is indicating that I should still be net short, and that we are still in a bear market. This is not because I am a perma-bear; if the market continues to climb, my portfolio will become increasingly long. On the other hand, if the market falls, I will become increasingly short. In other words, what I think (or what anybody else thinks) has nothing to do with it.

Anyway, to help keep my portfolio balanced, I shorted this stock on Friday:


The central theme of the shorts outlined this weekend are stocks that have not participated in the general rally of the market.

It is sometimes said that a rising tide lifts all boats. With this stock market rally, we have seen a rising tide, but a few boats have not risen. To continue the analogy, these boats that did not rise, could be said to be in disrepair or taking on water, and are thus more likely to sink once the tide recedes.

Lexmark Inc. (LXK)

Because so many of my previous shorts were stopped out, I must add new shorts to my portfolio in order to prevent a situation in which I would be entirely long. I initiated a short position in this stock on Wednesday.

St. Joe Corp. (JOE)

Here is a new 52 week low:

Southwest Airlines (LUV)

Perhaps an opportunity to use this bit of strength to initiate shorts. The overall trend is still down:

Norfolk Southern Corp. (NSC)

Silver ETFs for Trend Following Traders

I think that yesterday's extreme volatility served as another reminder of the importance of having a portfolio exposed to many different sectors to spread risk.

But I am not an advocate of diversifying just for the sake of diversifying. For example, I am against fund of fund mutual funds or ETFs that invest in thousands of different stocks.

For example, if you design your portfolio to replicate the S&P 500, you may think that having 500 stocks in your portfolio is providing you with diversification. In reality, your portfolio would be 100% large caps, 100% equities, 100% long, and 100% American, and thus very much concentrated.

A more logical approach would be to consider shorting stocks, going into commodities, currencies, or bonds. One commodity that tends to move independently from the stock market is silver. Here are 3 ways to play silver if one were so inclined:

Here is a closed end fund called the Central Fund of Canada:


This fund trades like an ETF, and has a ticker symbol, CEF, just like a stock would. The fund's unerlying assests consist of approximately 57% gold, 40% silver, and 3% cash.

The next ETF is more popular, and follows silver directly:


Each unit of this fund is meant to represent 1 troy ounce of silver, so it does not suffer from compound interest issues found in ultra ETFs. Speaking of Ultra ETFs, there is one for silver as well:


Since silver by itself can be very volatile, this fund should be traded with caution, if at all.

I placed a buy stop on SLV this afternoon, which was hit. In my opinion, the entire precious metals sector looks favourable right now, but time will tell.

Fuel Systems Solutions (FSYS)

Here is another stock that is not participating in the market's rally.

Also, I think it makes sense to add to short positions after bear market rallies. Don't let these last couple of days fool you, we are still unquestionably in a bear market...

Ocwen Financial Corp. (OCN)

But even in a bear market, I will not go 100% short. If this stock surpasses its intra-day high of $10.05, my buy stop will be hit, and I will become a proud Ocwen Financial shareholder.

Data Domain Inc. (DDUP)

Just looks bad:

Pall Corp. (PLL)

This stock is obviously in a downtrend, but what separated this stock from others is the recent bearish gap down:

Michael Covel on Trend Following

Becoming a trend following trader was not my initial goal when I first decided that I wanted to become a trader. It was a process of traversing through a long winding labyrinthine path met with many dead ends before arriving at this style.

I intuitively thought that one needed to predict the market in order to become a trader. This path seems to be plagued by charlatans of every sort, trying to sell amateurs the next great indicator or "secret".

I actually think that there is an inverse correlation between one's skill as a trader and their propensity to write a book or newsletter about trading. I mean if you are a trader that really understands what you are talking about, and you have made several million dollars in the market, why bother to provide seminars or write newsletters.

This makes learning about trading difficult for amateurs, since many of the great traders keep quiet, while the charlatans never give up (if they did, they would lose their only source of income).

However, not all authors or newsletter writers are charlatans. One author that I am very much impressed by is Michael Covel. Michael Covel is the author of two books, and a blog (refer to my links section).

Michael Covel writes persuasively and logically on the topic of trend following, and on many other topics on his blog. Here is a video of Michael Covel describing the basics of trend following:

Firstenergy Corp. (FE)

A very poor performance, this week was for me. Some of my shorts were squeezed very badly, like, for example, IP up an incredible 51%. But for me to give up all of my profits, the stock would have needed to rally by about 109%

I mentioned before that compound interest works against short sellers. This is true if the trend continues, but if the stock turns around, it works for your protection. For example, if you short a stock, and it declines 50% in week 1, and rebounds and gains 50% in week 2, you are still profitable by 25%

Also, my Asian stock hedge failed miserably, as this sector did not participate in this week's rally.

The only bright spot was in one of my long position, CVTX, which gapped up 32% on Thursday.


Here are the trades I placed this week:

Sold K.to (was trading below 50dma, other gold stocks look better)
Shorted FST
Sold HBU.to (margin call)
Covered ANSS (stopped out)
Sold MRU/a.to (margin call/stock entered sideways trend)
Sold EWM (relative strength stopped out)
Bought AMZN (breaking out)
Covered FST (broker buy out)


Anyway, here are 2 stocks I scanned today:


After a big rally like we had this week, I like to find stocks that did not participate. My logic is that if a stock cannot rally when the rest of the market is, it must surly be in weak hands.

One theory I have is that when a company is facing serious problems, there are likely many investors on the inside looking to dump their shares before things get even worse.

However, if the shares are dumped on a down day, the excess supply could really crater the stock. So they wait until the market is rallying hard to dump their shares, so that there is some underlying demand to absorb the large positions. The stock could still close down, but not nearly as severely had the market been down that day.

Notice in the above chart that this 52 week low was made on record volume.

Alaska Communications Systems Inc. (ALSK)

iPath Copper Total Return ETN (JJC)

This fund, quite simply, follows the price of copper on a one to one basis. I have been following this fund for a while, and it is now on my radar screen as a potential long candidate due to its recent strength. The blog HeadlineCharts also picked up on copper's strength a few weeks back.

Here is a daily chart of the fund:


As the above chart shows, JJC is now trading above its 50 day moving average, which is one of the first stages towards a full fledged uptrend. For me to go long a stock, I would prefer for the 50dma to cross the 200dma.

A crossing of these two moving averages is a relatively arbitrary event, and it does not "cause" a stock to rise. It is, however, a sign that a stock has entered an uptrend.

Another aspect that caught my attention was the two recent spikes in volume. This fund normally trades about 30,000 shares a day, but today over a quarter of a million shares traded hands.

Finally, another development in regards to this fund is its recent strength even against other commodities, as measured by the CRB commodity index:


Not only is this fund rising, it is rising faster than most other commodities. If I am going to go long a commodity, it might as well be the one that is performing the strongest.

How Trend Followers Handle Countertrend Moves

Being net short, it was not surprising that I got somewhat crushed by todays intense rally. That being said, I must accept it as a cost of doing business, as any bear market will occasionally experience days like today.

Shorting stocks in a bear market makes sense in the long run, and I do not let these sharp corrections bother me too much. Conversely, going long in a bull market makes sense, despite there being periodic corrections as well.

In fact, corrections in a bull market have the potential to be more severe that corrections in a bear market. There have been numerous instances were stocks have fallen by 10% or more in a day, but rarely will a market rise 10% or more in one day. Yet, paradoxically, shorting is still widely regarded as being more risky.

I am sure the question on a lot of peoples mind is whether this rally was just a dead cat bounce, or the start of something much larger. Personally, I have no idea. My philosophy is to not predict what the market will do; I only react to what does eventually unfold.

I did not cover any of my shorts today. I try not to let one days market activity distract me from viewing the long term picture. For example, compare these 2 monthly charts of the S&P 500:

One day before the correction (March 9th):


After the correction (March 10th):


As you can see, the big picture (the bear market) has not changed. I believe that at this point there is no justification to make any significant modifications to my portfolio. However, if the market continues to rally, I will slowly and gradually rotate out of some of my short position, and into long positions. If the big picture changes, then so will my portfolio.


Anyway, please refer below for more candidates...

American Apparel Inc. (APP)

It seems that a rising tide does not lift every boat. This stock hit a 52 week low despite the market rising nearly 6% today. I cannot see how this fact could be construed as being bullish:

Amazon.com (AMZN)

This stock was brought to my attention after reading the blog Zentrader:


This stock was identified by Zentrader due it finding resistance against its 200dma. In my opinion, if the stock breaks this barrier, I would consider going long.

In addition, AMZN is doing exceptionally well against the overall market:

Autozone Inc. (AZO)

I am mentioning this stock again due to its continued strength:

Asian Stocks are Outperforming

I mentioned last week that I had bought the Malaysian iShares ETF to provide my portfolio with additional diversification and because it was one of the world`s strongest markets.

So far I am down over 2% on this trade, and yet I am quite pleased with the position. This is due to the fact that the S&P 500 has dropped by around 7% during the same time, which means that this ETF is still showing excellent relative strength.

In fact, if you observe this next monthly chart of Malaysian stocks versus SPY, you will see what I believe to be a long term trend as well:


Southeast Asian stocks certainly were not an ideal investment in 1997-1998, but have since been showing stronger growth than the S&P 500.

To be clear, I am not concerned as to why this occurring, nor am I concerned how long this trend will last. I am only aware that this is a trend, and that I am willing to go along with the trend for however long it lasts.

Anyway, Malaysian stocks are not the only geographical area that is showing strength; most of Asia is doing much better than American, as the next chart shows:


The above chart is a daily chart showing the Hong Kong iShares against SPY. They too are breaking out to new highs.

Although American stocks are showing clear signs of relative weakness, they are not the worst performing market in the world right now. In fact United Kingdom stocks (EWU) are doing slightly worse, and Mexican stocks (EWW) are not fairing any better.

I would like to take this line of thought to the next level, by looking at the best international market (Malaysia) versus the worst international market (Mexico):

As you can observe with the above daily relative strength chart, there is quite a trend going on. Again, to get on board this trend, one would have to buy EWM and short sell EWW.

What is interesting is that this trend could be profitable if the markets falls 10% tomorrow or if the markets rise 10% tomorrow, since it is all relative.

Johnson Controls Inc. (JCI)

For my records, and for anybody who is interested, I did 3 trades this week:

1) Shorted ANSS
2) Bought CVTX -I sense that a major move is going to occur with this stock (either up or down)
3) Bought STAR -Bought on Friday (at almost the worst possible time)

With these additions, I am now holding 17 different positions. I feel that after you build a portfolio of 15-20 stocks, the marginal diversification added by each new position begins to decline. Therefore, I will be less inclined to add new positions at this point.

Here is what I am holding at this moment:

Short:

AFL
ANSS
CEDC
DOW
IP
KBE
RAI
TTWO
VIP

Long:

CVTX
EWM
HANS
STAR
HBU.to
HND.to (this is a bear ETF)
K.to
MRU/a.to


Below are 3 more candidates:


There were more than 100 stocks identified in my 52-week low scan. I liked this one the best.

Verenex Energy Inc. (VNX.to)

Stock identified with volume scan:


International Tower Hill Mine Ltd. (ITH.V)

This stock appears quite hot, but who knows when the trend will end...

Horizons BetaPro Crude Oil ETF Analysis

This post will discuss two popular ETFs that track the price of crude oil. The implications in this post are applicable to any other type of ultra ETF:

1) Horizon Oil Up (HOU): Designed to rise 2% for every 1% crude oil rises on a daily basis

2) Horizon Oil Down (HOD): Designed to rise 2% for every 1% crude oil falls on a daily basis


Now, imagine it is the summer of 2008, and oil is trading at $147.00 a barrel. You feel oil is overvalued (whatever that means), and you feel like picking a top in the market. There are actually two options (with pros and cons) that you have at your disposal:

1) Buy HOD (the bear ETF):

-would rise if oil fell (good -if your prediction is right)
-have to pay the management expense ratio (bad)
-losses are limited to your principle (good)
-compound interest works in your favour (good)
-credit risk (risk if there is problems with the ETF provider) (bad)


2) Short HOU (the bull ETF):

-would fall if oil fell (good- if your prediction is right)
-you get paid the management expense ratio (good)
-losses are potentially unlimited (bad)
-compound interest works against you (bad)
-no credit risk (could actually benefit in the event of financial instability of ETF provider) (good)


So, back to oil at $147 a barrel. What are you better off doing- buying the bear ETF or shorting the bull ETF?

This question is answered in the following chart. We have HOU on the top panel, and HOD on the bottom panel illustrating how a $10,000 would have fared in each scenario:


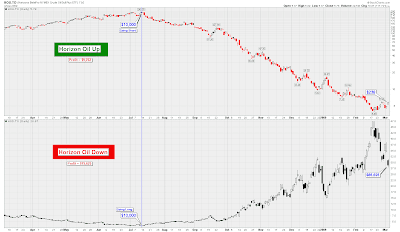
As you can observe, simply buying the bear ETF would have resulted in a much more profitable outcome. The main reason for this is simply because compound interest is working in your favour when you are holding the bear ETF, HOD.

Stated another way, compound interest works against short sellers. Also, when you are short selling, you cannot make more than your principal. The ETF cannot decline to less than zero, in other words.


Along the same topic, and to have a bit of fun, whomever first writes a comment with the correct answer to these questions will get one of my favourite trading books sent to them, in ebook format (be sure to include an email address):

1) You short a stock in a downtrend. The trend persists, and the stocks ends up falling by 80%. At this point, how much would the stock have to rally for you to lose all of your profits and return to break even?

2) You short a stock for $50.00 a share. Each day thereafter, the stock falls 5%. Assuming that the stock continues to fall 5% per day, how many days will it take for the stock to become completely worthless?

Ansys Corp. (ANSS)

I did not run my scans today, so there are no new stock selections. The reason is that I have a sufficient number of candidates sitting on the back-burner. But because I earned some additional margin yesterday, I was able to add this position, which I identified last week:

I was filled at a price of $19.30 a share. My buy stop has been set at $21.76. Furthermore, here is a weekly chart of the same stock:


I don`t know about you, but I cannot find very many redeeming qualities in this stock. The path of least resistance is clearly to the downside, which does not guarantee anything, but at least puts the odds in my favour.

Take-Two Interactive Software, Inc. (TTWO)

I have been short this stock since January 7th, but the reason I post this chart is because of the technical breakdown that just occurred.

I may add to my original short position tomorrow:

Process Versus Outcome in Trading

This concept of process versus outcome was first introduced to me when I read the book, "More Than You Know", by Michael Mauboussin. It was also discussed in the books written by the brilliant authors Michael Covel and Mark Douglas.

The best way to explain the concept is using the following examples, which involves the game black jack (the only card game I know).


1) Good Process/Good Outcome

The cards you are dealt add up to 12. You have the choice to stay or hit. You choose to hit and receive a 9-blackjack.

The equivalent scenario, in my view, in the stock market is that you see a stock in a downtrend, so, following your rules, you short it. The stock ends up falling another 40% before turning around.


2) Good Process/Bad Outcome

The cards you are dealt add up to 12. You have the choice to stay or hit. You choose to hit and you get a 10 -bust.

In the stock market this is comparable to buying a stock that is in an uptrend, which has recently broken out of it's range on good volume. Following your rules, you buy the stock. Moments after you buy it, it tanks, and you get stopped out.


3) Bad Process/Good Outcome

The cards you are dealt add up to 20. You have the choice to stay or hit. You choose to hit and receive an ace- blackjack.

Comparatively, this is similar to buying a stock that is in free fall. You don't follow your rules, and you just dive into the market. After buying the stock, it miraculously turns around, and you sell at a profit.


4) Bad Process/Bad Outcome

The cards you are dealt add up to 20. You have the choice to stay or hit. You choose to hit and receive a 10 -bust.

Your favourite bank stock is hitting another 52 week low. You feel that the dividend yield is attractive, and, on top of that, the stochastics are oversold, so you decide to 'back up the truck' and double down. One week later, the bank goes bankrupt, and you lose everything.


Every trade I do I feel has a good process. I always follow the same rules for every trade, which include making sure I am trading with the trend, making sure that I am not over-trading, and making sure that I always set my stops appropriately.

However, not every trade I do has a good outcome. But if your process is good (that is, you trade with an edge), then over the long run, you will begin to see the results.