High Potential Stock of the Week

Just a quick post today.   After running my scans this weekend, I was only able to find one stock candidate that appealed to me:


The stock above appeals to me because it is making a new all time high, it is breaking out of a consolidation area, it is in an uptrend and it is doing all of this on above average volume.


High Potential Stocks of the Week

The market remains in an uptrend, which means that it is now time for me to buy another stock.  As long as the market remains in an uptrend, I will add one new stock per week, up to a maximum of six.

Also, I only run my scans and select my stocks on the weekend.  The first reason for this is that the weekly charts are fully formed by the weekend, and the second reason is that one can experience a higher level of calm on the weekends since the markets are closed and the dust has settled.

Here are the two best stocks that my scans found this weekend:


The stock above is making a new multi-year high after breaking out of a consolidation area.

Next:


After gapping up, this stock went on to make a new 10-year high on heavy volume.


Market Moves Back to Green Light

The short-term trend of the market shifted to up this week.  Now that the trend is up, I am given the green light to go ahead and buy stocks again.


With the benefit of hindsight, I would have been better off just holding stocks through this most recent correction, but I have no regrets, as I followed the rules of my system.

As Trader Steve noted, it has been a difficult, choppy year for trend followers.  Although this year was not particularly conducive to trend followers, I feel that it is important to accept and be grateful for whatever the market gives you.

Anyway, here are two stocks that I think look strong this week:


The stock above is making a new all time high after going through, what I consider to be, a lengthy consolidation.   I'll be buying this stock tomorrow as well as closing out my position in TLT.


This stock above, which is clearly in an uptrend, is also looking strong to me.

Lastly, to add to my post last week, here is another trend following ETF, but one that follows gold:


An ETF for Trend Followers

A couple of weeks ago, I talked about a simple, but profitable trend following strategy that goes long when the market is above its 200 day moving average and goes into cash when the market is below it.  Later on, I found out that there is an ETF out there, ticker symbol TRND, that is essentially utilizing this strategy already.

The ETF will track the S&P 500, but will exit and go into cash automatically if the market closes below its 200 day moving average for five consecutive business days. The ETF will re-enter the S&P 500 if it crosses back above the same moving average for five business days.

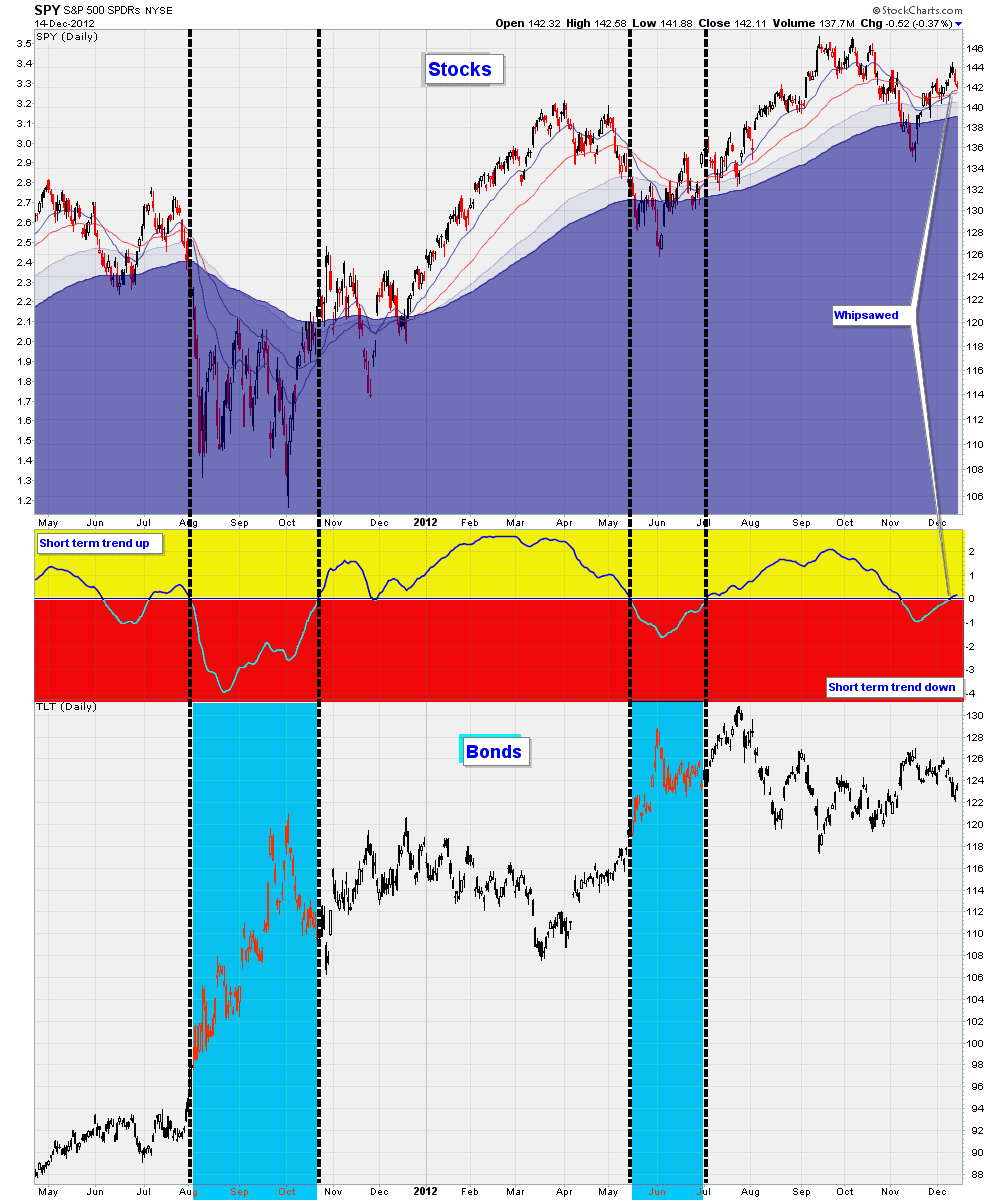
Below is a chart showing the ETF in action:


The chart above shows the ETF going into cash last year when the market plunged below its 200 MA, and subsequently re-entering at around the start of this year.   Since the market has never traded below its 200ma for five consecutive business days, the ETF has simply matched the performance of the S&P 500 this year.

What I find noteworthy is that this very simple strategy has outperformed buying holding for the last 3, 5 and 10 years, and also has outperformed when backtested from 1954 - all with significantly reduced volatility (source).

Here is an historical chart of this strategy versus buy and hold going back to 1991:


Notice, for example, how this strategy went into cash during the 2008 stock market meltdown, so that when the markets eventually did recover, the ETF was able to participate in the rally with much more cash than buy and holders.

To be sure, I am of the opinion that there are better systems than this, but I think this product is a good start and certainly much better than buying and holding.


Some Thoughts on Back Testing

One of the purposes of this blog is to allow me to share ideas and also to get into contact with other trend following traders.  I also occasionally email successful trend following traders in order to glean precious insight from them.  About 2 months ago, I emailed Canadian trend following trader, Jason Russell with a few questions.   Jason Russell, who was a student of Ed Seykota and profiled in Michael Covel's book Trend Following, graciously provided me with a bit of advice:


It sounds like you are on the right track with the exit and breakout ideas. I believe that I would be doing you a disservice in offering anything further other than suggesting that you learn how to define an idea so precisely that you can code it up and test it.


Since I have never been a mechanical trader (I am a rules based discretionary trader), I have never attempted to back test any strategies.  This email, however, provided me the impetus needed to delve into the world of back testing.  


I found a great program for back testing called Trading Blox, which is so simple to use, even I, with no programming skills,  was able to figure it out.   You can download a free trial of the program here.


My intention is not to alter my stock trading system (I am satisfied with that), but to create a Forex trading system to trade in addition to trading stocks.  I have decided to trade a system based on Donchian Channel breakouts, which is a system somewhat similar to what the Turtles traded as outlined in Michael Covel's second book


There is a lot I could discuss about this system, but I would like to focus on just one key variable, which is how much should be risked on each trade. You can't control how much money a trade will make,  but you can control how much you are willing to lose.   Below are the results of my system using different bet sizes:


In the table above, we see that in the first row, risking 0.25% on each trade using my system results in a 10.34% annualized rate of growth, with a maximum drawdown of 26.9%.   The back test was for all liquid futures and used data from 1996 until today.

The row highlighted in blue represents the results of using a 1% risk per trade, a figure often used by veteran traders.

Below is a graph showing risk per trade versus return:


So, basically, if you risk much more than 2% per trade, results become worse (and drawdowns begin to get pretty horrendous).

In summary, the results of my back test confirm what I had already suspected to be true:  don't risk more than 2% per trade.


We approach markets backwards. The first thing we ask is not what can we make, but how much can we lose. We play a defensive game.

-Larry Hite


Never risk more than 1% of total account equity on any one trade.  By risking 1%, I am indifferent to any individual trade.  Keeping your risk small and constant is absolutely critical. 

-Larry Hite


There are old traders and there are bold traders, but there are very few old, bold traders.

-Ed Seykota