Just a quick post today. After running my scans this weekend, I was only able to find one stock candidate that appealed to me:
The stock above appeals to me because it is making a new all time high, it is breaking out of a consolidation area, it is in an uptrend and it is doing all of this on above average volume.
The market remains in an uptrend, which means that it is now time for me to buy another stock. As long as the market remains in an uptrend, I will add one new stock per week, up to a maximum of six.
Also, I only run my scans and select my stocks on the weekend. The first reason for this is that the weekly charts are fully formed by the weekend, and the second reason is that one can experience a higher level of calm on the weekends since the markets are closed and the dust has settled.
Here are the two best stocks that my scans found this weekend:
The stock above is making a new multi-year high after breaking out of a consolidation area.
Next:
After gapping up, this stock went on to make a new 10-year high on heavy volume.
The short-term trend of the market shifted to up this week. Now that the trend is up, I am given the green light to go ahead and buy stocks again.
With the benefit of hindsight, I would have been better off just holding stocks through this most recent correction, but I have no regrets, as I followed the rules of my system.
As Trader Steve noted, it has been a difficult, choppy year for trend followers. Although this year was not particularly conducive to trend followers, I feel that it is important to accept and be grateful for whatever the market gives you.
Anyway, here are two stocks that I think look strong this week:
The stock above is making a new all time high after going through, what I consider to be, a lengthy consolidation. I'll be buying this stock tomorrow as well as closing out my position in TLT.
This stock above, which is clearly in an uptrend, is also looking strong to me.
Lastly, to add to my post last week, here is another trend following ETF, but one that follows gold:
A couple of weeks ago, I talked about a simple, but profitable trend following strategy that goes long when the market is above its 200 day moving average and goes into cash when the market is below it. Later on, I found out that there is an ETF out there, ticker symbol TRND, that is essentially utilizing this strategy already.
The ETF will track the S&P 500, but will exit and go into cash automatically if the market closes below its 200 day moving average for five consecutive business days. The ETF will re-enter the S&P 500 if it crosses back above the same moving average for five business days.
Below is a chart showing the ETF in action:
The chart above shows the ETF going into cash last year when the market plunged below its 200 MA, and subsequently re-entering at around the start of this year. Since the market has never traded below its 200ma for five consecutive business days, the ETF has simply matched the performance of the S&P 500 this year.
What I find noteworthy is that this very simple strategy has outperformed buying holding for the last 3, 5 and 10 years, and also has outperformed when backtested from 1954 - all with significantly reduced volatility (source).
Here is an historical chart of this strategy versus buy and hold going back to 1991:
Notice, for example, how this strategy went into cash during the 2008 stock market meltdown, so that when the markets eventually did recover, the ETF was able to participate in the rally with much more cash than buy and holders.
To be sure, I am of the opinion that there are better systems than this, but I think this product is a good start and certainly much better than buying and holding.
One of the purposes of this blog is to allow me to share ideas and also to get into contact with other trend following traders. I also occasionally email successful trend following traders in order to glean precious insight from them. About 2 months ago, I emailed Canadian trend following trader, Jason Russell with a few questions. Jason Russell, who was a student of Ed Seykota and profiled in Michael Covel's book Trend Following, graciously provided me with a bit of advice:
It sounds like you are on the right track with the exit and breakout ideas. I believe that I would be doing you a disservice in offering anything further other than suggesting that you learn how to define an idea so precisely that you can code it up and test it.
Since I have never been a mechanical trader (I am a rules based discretionary trader), I have never attempted to back test any strategies. This email, however, provided me the impetus needed to delve into the world of back testing. I found a great program for back testing called Trading Blox, which is so simple to use, even I, with no programming skills, was able to figure it out. You can download a free trial of the program here. My intention is not to alter my stock trading system (I am satisfied with that), but to create a Forex trading system to trade in addition to trading stocks. I have decided to trade a system based on Donchian Channel breakouts, which is a system somewhat similar to what the Turtles traded as outlined in Michael Covel's second book. There is a lot I could discuss about this system, but I would like to focus on just one key variable, which is how much should be risked on each trade. You can't control how much money a trade will make, but you can control how much you are willing to lose. Below are the results of my system using different bet sizes:
In the table above, we see that in the first row, risking 0.25% on each trade using my system results in a 10.34% annualized rate of growth, with a maximum drawdown of 26.9%. The back test was for all liquid futures and used data from 1996 until today. The row highlighted in blue represents the results of using a 1% risk per trade, a figure often used by veteran traders. Below is a graph showing risk per trade versus return:
So, basically, if you risk much more than 2% per trade, results become worse (and drawdowns begin to get pretty horrendous). In summary, the results of my back test confirm what I had already suspected to be true: don't risk more than 2% per trade.
We approach markets backwards. The first thing we ask is not what can we make, but how much can we lose. We play a defensive game.
-Larry Hite
Never risk more than 1% of total account equity on any one trade. By risking 1%, I am indifferent to any individual trade. Keeping your risk small and constant is absolutely critical.
-Larry Hite
There are old traders and there are bold traders, but there are very few old, bold traders.
The market rose sharply this week. Since I am completely out of stocks, I was not helped or harmed by this turn around. To reiterate, I am out of stocks because the short-term trend turned down. However, I am not short stocks either because the long-term trend remains up.
Below is a chart of the S&P 500 going back to the mid 1990's and shows the long-term trend of the market using a 100 and 150 moving average cross over.
The areas highlighted indicate times where the long-term trend was down and shorting would have been acceptable. In my view, shorting stocks at this time is still premature.
While stocks are neutral, other areas are, in my view, more positive. One such area is gold, which I bought through the exchange traded fund GLD this week.
Unlike the S&P 500, GLD remains in an uptrend and is looking strong to me.
As I continue to wait to see whether the stock market tells me to buy stocks again or to short stocks, I enjoy exploring new trend following related resources. Below are a list of resources that I found useful this month:
The market declined again this week resulting in the S&P 500 breaking its 200 day simple moving average. Although I use a a 150 day moving average in all of my charts, the 200 day is more popular among technical analysts. The chart below shows that the market has now broken both moving averages:
What does this event mean for the market? Keeping in mind that anything is possible with the market going forward, a break below the 200 day moving average is a bearish development and I will present some evidence in support of this.
The blog All Time High Stocks breaks down a study which, among other things, backtests the performance of a buy and hold strategy versus a very simple strategy of buying the market when it is above its 200dma and selling when the market crosses below.
The study backtests the S&P 500 from the year 1928 to 2010. Interestingly, the average annual rate of return for the market for buy and holders was only 4.86% during this 82 year period. But what if you were only invested during the times when the market was above its 200dma? Your average rate of return more than doubles to 10.29% annually.
The study also performs the same backtest to several other global markets, and I have summarized the findings in the table below:
On average, just being invested in up-trending markets, simply defined by the 200dma, doubles the rate of return relative to buying and holding.
While there are other simple systems that perform even better, learning to get out of a market, stock, commodity, mutual fund etc... when it crosses below its 200dma is a good start.
Selling pressure intensified this week, which finally pulled the S&P 500 into a short term down trend. The chart below shows the buy and sell signal generated by my system:
The signal generated in the summer started off quite well, but ended being only marginally profitable as the trend quickly reversed. The stocks I selected I think did good (but not great) and I calculate that I am up 15.22% YTD.
Now that the short term trend is down, I cannot own any stocks in my account. Bonds, however, often do well in this environment:
Immediately after unloading all of my positions on Friday, I bought the long term bond ETF, TLT:
Notice how this chart is breaking out just as the general market is breaking down. Meanwhile, Canadian bonds are also looking strong, making a new record high on Friday:
I don't really have anything to add to last week's post. To reiterate, I am focusing on the short term trend of the S&P 500 to tell me what to do next: if the short term trend remains up, I will continue holding my stocks; if the short term trend turns down, I will move into cash or bonds.
Meanwhile, with the election right around the corner, I naturally began thinking if there was any connection between that and the world of trend following. As a matter of fact, there is. The University of Iowa runs what is called The Iowa Electronic Market. Here is their description posted on the official website:
The Iowa Electronic Markets are operated by faculty at the University of Iowa as part of our research and teaching mission. These markets are small-scale, real-money futures markets where contract payoffs depend on economic and political events such as elections.
So, basically, you could open an account and bet, with real money, who you think will win the forthcoming election. Here is how the graph of this futures market looks like now:
The chart above shows that the traders of this market are pricing Romney at about 28 cents and Obama at about 72 cents. In other words, this translates to Obama having about a 72% chance of winning on Tuesday.
Interestingly, these futures market have an uncanny ability to be more accurate than any expert and most polls, as was the case during the previous election:
It is my view that the price of any market is king. Through the wisdom of crowds, markets are able to allocate scarce resources better than any one expert, guru or bureaucrat. This, in turn, is why price (or a moving average of price) is the only indicator I use in my trading.
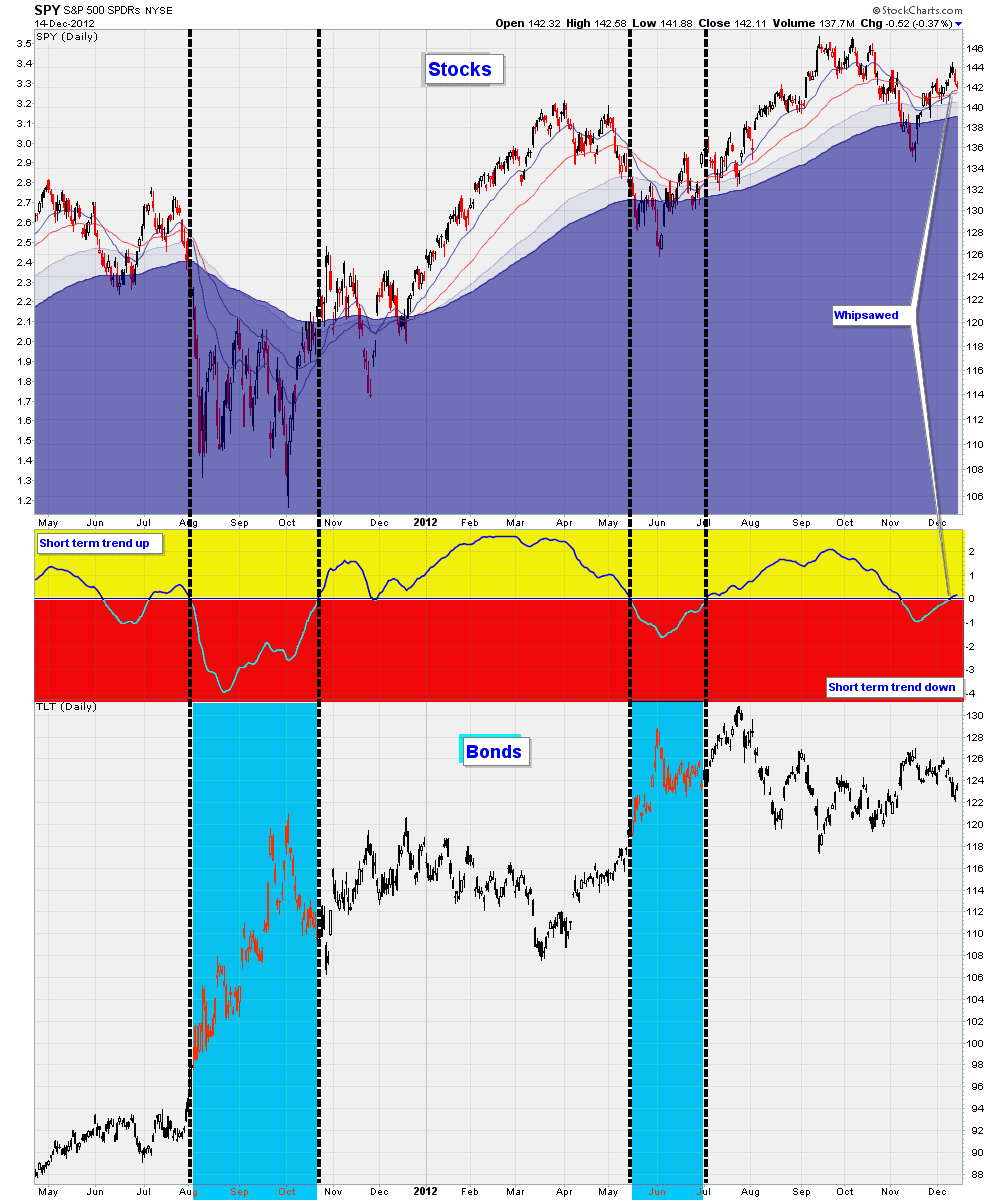
Despite considerable weakness in the general market, the short-term trend remains up. I define the short-term trend using a 20 and 50 day exponential moving average.
Because I want the odds to be as much in my favour as possible, I only buy stocks when the short and long term trend of the general market are up. Therefore, when the short-term trend changes, I will have to go into cash or bonds.
Going into bonds when the markets are going sideways or down has worked for me in the past, as the chart below shows:
The chart above outlines the areas where the short-term trend of SPY turned down and also shows correspondingly how bonds, as measured by TLT, did. The bond ETF tends to do quite well during market corrections.
Next, is another bond fund, that contains shorter term maturities, IEF:
If the general market's trend changes, I may go back into US Bonds. Although the technicals look strong, the fundamentals for US government bonds seem incredibly weak. In fact, here is what legendary investor Jim Rogers had to say about the topic:
It's too late for moderate measures. We're coming to a time when only only strong measures will stop the haemorrhaging. Even if we somehow balance the budget tomorrow, there's still the debt of trillions of dollars for someone to pay... If this sounds radical, all I can say is wait until everything collapses around us.
Would you buy US Bonds after hearing such dire words? Yes, if you have a trading plan, use risk management, and have an exit strategy, you can ignore all forecasts. Rogers, by the way, wrote this not this year, nor last year, but way back in 1994 in his otherwise great book, Investment Biker.
The chart below is a daily chart of AAPL. This stock has been in a short and long term up trend for almost a year and has rewarded trend followers handsomely. As is often the case, this stock shows that what often seems "too high" often simply goes even higher.
However, the short term trend did turn down last week, which is a signal to close out any long positions in the stock. Because the long term trend remains up though, my system would not allow shorting this stock.
Last week, I mentioned that the TSX entered a new bull market. I am still seeing a lot of strength in resource related sectors. The chart below shows the Canadian iShares performing much more strongly than QQQ:
Similarly, the Australian iShares hit a new 52-week high on Thursday:
Lastly, for next week, I plan on adding to my second biggest winner currently in my account, SNA:
By any definition, this stock is in an uptrend, hitting new highs and showing relative strength.
I only placed one trade this week, which was to sell GRU. I bought this grains ETF while it was making fresh new highs, but it subsequently reversed to quickly become my biggest loser. Fortunately, because risk management is of paramount importance to me, this lose only resulted in my total account equity dropping by 2%.
This theme of risk management, drawdowns and the idea of process versus outcome is brilliantly touched on by Australian trend follower Nick Radge in the video below:
Most stock indices have been down for the past 6 consecutive days, but what I would like to point out is that all global markets remain in up-trends.
The short-term trend for the S&P 500 turned up in early July and remains up today, as the chart below shows:
I define the short term trend using a 20 and 50 day moving average, which are still positively aligned at this moment. Following my rules, I am allowed to continue holding stocks in my account for as long as that condition is true.
Meanwhile, as US markets meander, most commodities are either making new highs or are consolidating. Silver miners, for example, recently entered a new bull market this week:
The chart above shows SIL, a silver miners ETF. Notice the recent relative strength on this one. In addition to this ETF, other funds such as: GDX, GDXJ, GLD and SLV are looking similarly bullish.
With so many commodity stocks rising, it is no surprise that the resource laden TSX entered a new bull market for the first time in 14 months:
Like an enormous pendulum, the long term trend takes a while to swing around and only tends to happen perhaps 5 to 10 times per decade. Although the TSX is at about the same level it was 14 months ago, following this long term signal kept you out of this market, allowing you to capitalize on other, stronger, markets.
Lastly, over the past month, I've discovered some excellent trend following related websites (refer to my links section). There are quite a few trend followers out there and there are a lot of people who have blogs, but there are not many people who are trend followers AND who blog about it, so it's always a pleasure when I stumble upon one.
According to my written rules, I cannot add any new positions to my account. I've got 7 positions open and a double short on VXX, which is the most risk that I can accept. Therefore, I didn't run my scans this weekend, but I will post some major trend changes of note.
I go through about 200 ETFs each weekend and this newer ETF caught my eye this week. Although the fund is still in a long term down trend, that could change soon if the short term trend continues:
Also, another ETF that is showing a lot of short-term strength is the natural gas ETF, UNG:
Any trend follower should have avoided buying this as the trend has been down for ages, losing 95% of its value since its high. Personally, I would prefer never buying such an ETF, as I prefer to gain long exposure to a commodity by shorting an ultra short ETF.
There is an ultra short natural gas ETF, ticker symbol KOLD:
Chronic money losers such as VXX, ZSL, GLL, FAS, FAZ etc... will be be charted in black to indicate that they are short candidates only for me. Just as two negatives equal a positive, shorting a short ETF means that one would benefit if the underlying commodity rose.
A money losing week for me this week, but the market is still in an uptrend and my stops were not hit, so nothing has changed.
The grains ETF that I bought 2 weeks ago has proven to be quite weak and has quickly become my biggest loser. The good news is that the ETF did find support along a major gap, which in my years of market observation, happens more often than random chance would suggest.
The chart below is a weekly chart of GRU, an ETF that follows the price of corn, wheat, soybeans and soybean oil:
While the support is holding at the moment, I do not know if it will hold in the future. Despite this uncertainty, my decision is simple: either my stop will get hit or it will not.
Anyway, since the market is still in an uptrend, I will be adding a new long position next week. Here are some stocks that are at new highs:
The stock above is not at an all time high, but is at a new multi-year high.
Next, the stock above is explosively rising on tremendous volume.
Notice the gaps and new high on this one above.
The ETF above, ZSL, is an ultra short silver ETF. Notice that the ETF is making new all time lows while the underlying commodity, silver, is not even close to making new all time highs.
I quickly went over a couple hundred stock candidates this morning and here are 3 that are in uptrends, are displaying positive relative strength and have, what I consider, to be favourable chart patterns:
If you are a Stockcharts.com member and you enjoy these charts, be sure to follow and vote for my Public Chart List.
The market's uptrend continued this week. Following my rules, some positions were liquidated and these closed trades have been recorded in a spreadsheet that is available in my links section.
I feel that it is very important to write down all closed trades for one's records. If not, traders will tend to remember their good trades and repress their bad trades from their memories. Because much can be learned from past mistakes, it is essential to record all trades for future review.
In addition to closing out a couple of stocks, I added to one position, my short of VXX, as shown by the chart below:
My stock trading strategy involves two components. The first component is buying stocks that are making new highs (buy high). The second, and equally important, component is shorting or selling stocks that are making new lows (sell low).
Anyway, here are three commodities that are going up this week:
Although rather illiquid for my tastes, I continue to like the ETF above that follows the price of Cocoa. Notice, too, that the 100 day moving average has just supplanted the 150 day moving average - a bullish development in my view.
Next up, we have a an ETF that follows the price of grains:
The ETF above provides exposure to three commodities that, individually, all look technically strong: corn, soybeans and wheat. Blended together, the resultant mix also looks strong, as logically one would expect. Other ETFs that are similar, but have somewhat different blends of agricultural commodities are: DBA, and RJA
Lastly, the price of crude oil is currently going up. An Ultra ETF that goes down when Crude goes up is SCO. Like all ultra ETFs, SCO is very good at eroding in value and is a short candiate only:
I recently finished reading a book called The Perfect Swarm by Len Fisher. After reading at least 150 books on the market, I now like to read books on a more diverse range of topics, but I often find that even these books can occasionally offer valuable insight into trading.
In The Perfect Swarm, Fisher shares the results of an interesting experiment which involved 2 groups of students, one from Germany and the other from America, to answer a simple question: Which city has a larger population, San Antonio or San Diego.
Seeing as how both cities are in the United States, one would expect that the American students would better be able to answer this question, as they knew more information about both cities than the German students. Surprisingly, though, 100% of the German students guessed the correct answer - San Diego - but only about two-thirds of the American students knew the answer.
How did the German students do so much better? The reason is that they simply had never heard of San Antonio, but they had heard of San Diego, so they naturally assumed that San Diego must be the larger city. Clearly, in this case, having less information resulted in a better outcome.
Another book that touches on this notion that less information is better is Blink, by Malcolm Gladwell, who, incidentally, graduated from the same high school as I did in the small mennonite town of Elmira, Ontario. Below is an excerpt from Gladwell's website:
One of the stories I tell in "Blink" is about the Emergency Room doctors at Cook County Hospital in Chicago. That's the big public hospital in Chicago, and a few years ago they changed the way they diagnosed heart attacks. They instructed their doctors to gather less information on their patients: they encouraged them to zero in on just a few critical pieces of information about patients suffering from chest pain--like blood pressure and the ECG--while ignoring everything else, like the patient's age and weight and medical history. And what happened? Cook County is now one of the best places in the United States at diagnosing chest pain.
The above example shows that looking at fewer variables has helped doctors save lives, but can the same concept help you become a better trader? Think for a moment at how many variables you could look at when deciding whether or not to buy a stock:
Earnings, balance sheets, income statements, dividend yield, P/E ratios...
Analyst opinions, expert forecasts, news announcements, sales, new products...
FOMC meetings, ECB meetings, employment reports, GDP numbers, the election, inflation numbers...
Just as doctors who looked at too many variables made poorer diagnoses, traders who look at all or most of these variables will likely make poor trading decisions. What has really helped me in my trading is to, like the doctors in Chicago, reduce the number of variables to four:
What is the trend of the general market: Up or Down
What is the trend of the stock in question: Up or Down
Is the stock in question making a new high: Yes or No
Is the stock showing positive relative strength: Yes or No
I would say, therefore, that I am (unashamedly) an uninformed trader. I'll end this post with a zinger from Nassim Taleb's book, The Bed of Procrustes:
With the general market itself making new all-time highs, there are a tonne of individual stocks doing the same. Below are 3 high potential stock candidates that have recently made new highs:
The stock above made a new high on Friday and is performing very strongly relative to the general market.
Next, we have a stock that gapped up last month and that is now finding support along that gap. I especially like to buy stocks that gap up to new highs, since the gap often acts as support in the event that the stock proves weaker than you had anticipated.
One of my holdings, PPG, is an example of how a gap offers a line of defense against unexpected weakness.
Finally, we have a stock, SNY, which I have not idea what product or service it provides, but looks good nonetheless.
Because I have half a dozen stocks on the line now and all of my cash has been deployed, I will not be buying any of these stocks. I believe that when you've got a full position on, and your positions remain in up-trends, there is not much required to do except wait, as the quote of the week suggests.


 Finally, we have a stock, SNY, which I have not idea what product or service it provides, but looks good nonetheless.